PILLAR 3 2021
-
1 GROUP CONCISE RISK STATEMENT
As part of setting its Risk Appetite, Societe Generale seeks a sustainable development based on a diversified and balanced banking model with a strong European foothold and a global presence targeted on a few areas of strong business expertise. The Group also aims to maintain long-term relationships with its customers built on well-earned trust, and to respond responsibly to the expectations of all of its stakeholders.
-
1.1 FINANCIAL STRENGTH PROFILE
The Group seeks sustainable profitability, relying on a robust financial strength profile, consistent with its diversified banking model. In terms of financial ratios(1), the Group calibrates its objectives to ensure a sufficient margin of safety in relation to regulatory requirements. As of 31 December 2021, the Group’s CET1 ratio stood at 13.7% compared to 13.4% at the end of 2020, well above the regulatory requirement of 9.02% (“MDA” threshold - Maximum Distributable Amount, calculated as of January 1, 2022).
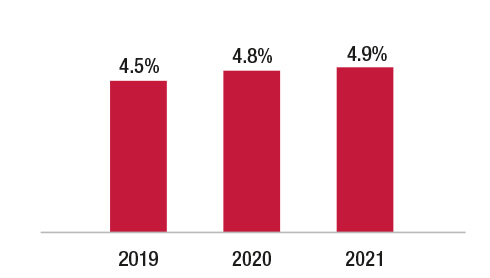
As of 31 December 2021, the Group’s leverage ratio stood at 4.9%, taking into account an amount of Tier 1 capital of EUR 57.9 billion compared to a leverage exposure of EUR 1,189 billion. euros (compared to 4.8% as of 31 December 2020, with EUR 56.2 billion and EUR 1,179 billion respectively).
In addition, as of 31 December 2021, the Group has a TLAC (Total Loss Absorbing Capacity) ratio of 29.2% of weighted exposures (compared to 28.6% as of 31 December 2020, for a regulatory requirement of 19.5% at the end of 2021).
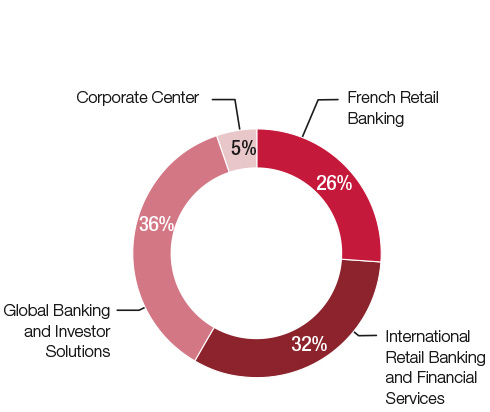
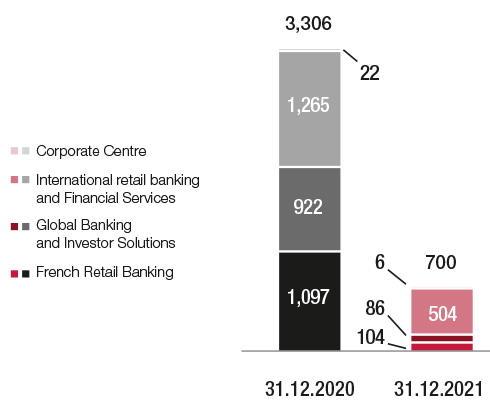
Regarding its risk profile, the Group has a balanced distribution of risk-weighted exposures (RWA) between its Global Banking and Investor Solutions divisions (36% as of 31 December 2021), Retail Banking and International Financial Services (33% as of 31 December 2021), Retail Banking in France (26% as of 31 December 2021) and Corporate Center (5% as of 31 December 2021). In terms of change, the Group’s weighted exposures stood at EUR 363 billion as of 31 December 2021 compared to EUR 352 billion as of 31 December 2020, an increase of +3%, mainly driven by the Banking division. Retail and International Financial Services.
(1)The solvency and leverage prudential ratios, as well as the amounts of regulatory capital and RWA featured here take into account the IFRS 9 phasing (fully-loaded CET1 ratio of 13.55% at end 2021, the phasing effect being +16 bps).
(In EURbn)
Credit and
counterparty credit
Market
Operational
Total 31.12.2021
French Retail Banking
91.8
0.1
3.7
95.5
International Retail Banking and Financial Services
112.1
0.1
5.5
117.7
Global Banking and Investor Solutions
89.3
11.5
30.3
131.2
Corporate Centre
11.7
0.0
7.3
19.0
Group
304.9
11.6
46.8
363.4
(In EURbn)
Credit and
counterparty credit
Market
Operational
Total 31.12.2020
French Retail Banking
94.4
0.1
4.4
98.9
International Retail Banking and Financial Services
102.3
0.1
5.6
108.0
Global Banking and Investor Solutions
79.0
15.0
31.9
125.9
Corporate Centre
11.6
0.2
7.3
19.1
Group
287.3
15.3
49.2
351.9
In addition, the Group presents its unconsolidated structured entities in Note 2.4 of the financial statements of the 2022 Universal Registration Document. Intra-group transactions are governed by a credit granting process respecting different levels of delegation within the Business Units, the Risk Department and the Finance Department. The entities’ structural risk management and oversight systems are also submitted to the Finance Department and the Risk Department.
-
1.2 CREDIT RISK AND COUNTERPARTY CREDIT RISK
Weighted exposures for credit risk and counterparty risk represent the Group’s main risk with an amount of risk-weighted exposures (RWA) of EUR 304.9 billion as of 31 December 2021, i.e. 84% of the total RWAs. These weighted exposures increased by 6% compared to 31 December 2020 and are mainly based on the internal model approach (63% of credit and counterparty risk RWA). This increase is mainly due to a growth in activity (+18 billion euros), mainly located in the Global Banking activity and by a foreign exchange effect (+5 billion euros), mainly linked to the appreciation the US dollar and the Czech koruna against the euro, partially offset by an improvement in the overall quality of the assets (-1 billion euros).
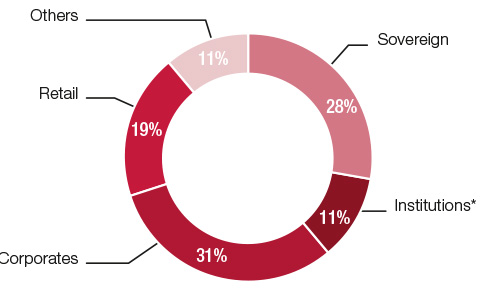
The credit portfolio presents a diversified profile. As of 31 December 2021, exposure to credit and counterparty risk represented an amount of EAD of 1,079 billion euros, up (+8%) compared to the end of 2020, driven in particular by the increase in exposures ” Companies”. The breakdown of the portfolio between main customer categories is balanced: Corporates (31%), Sovereigns (28%), Retail customers (19%), Institutions (11%) and Others (11%).
In terms of geographic breakdown of the portfolio, exposure to emerging countries remains limited: the Group’s exposure is 67% in Western Europe (including 46% in France) and 14% in over North America. In sectoral terms, only the Financial Activities sector represents more than 10% of the Group’s Corporate exposures, followed by the Real Estate Activities and Business Services sectors.
With regard more specifically to counterparty risk, exposure represents an amount of EAD of 144 billion euros, increased (+15%) compared to the end of 2020, linked to the significant increase in exposure to Institutions and to a lesser extent on corporate exhibitions.
As of 31 December 2021, EAD’s exposure to Russia represented 1.7% of the Group’s exposure to credit and counterparty risk, i.e. EUR 18.6 billion (including EUR 15.4 billion on its subsidiary Rosbank and 3.2 billion euros of off-shore exposure, mainly made up of operations set up as part of the financing activities of Global Banking and Investor Solutions)(1).
Regarding the Group’s net cost of risk, it amounts to EUR -0.7 billion in 2021, down -79% compared to 2020. The cost of risk is thus down sharply compared to 2020, due to a very low level of cost of risk on defaulted outstandings (stage 3) and moderate reversals of provisions on sound outstandings (stage 1/stage 2) while maintaining a prudent provisioning policy in an environment that remains marked by strong uncertainties.
Expressed in basis points (bp), the cost of risk thus stands at 13 bp for the year 2021 compared to 64 bp in 2020. This cost of risk is down across the three pillars Retail banking in France (5 bp full year 2021 vs. 52 bp for full year 2020), International Retail Banking and Financial Services (38 bp for full year 2021 vs. 96 bp for full year 2020) and Global Banking and Investor Solutions (5 bp for the year 2021 against 57 bp for the year 2020).
The gross coverage rate for doubtful outstandings decreased slightly to 51% as of 31 December 2021 (compared to 52% as of 31 December 2020), mainly due to the downward revision of the provisioning rates on defaulted outstandings of individual customers and professionals in France, reflecting improved collection performance and portfolio sales.
(In EURbn)
31.12.2021
31.12.2020
Group gross doubtful loans ratio(1)
2.9%
3.3%
Doubtful loans (Stage 3)
16.5
17.0
Stage 3 Provisions
8.4
8.8
Group gross doubtful loans coverage ratio
51%
52%
(1)Customer loans and advances, deposits at banks and loans due from banks, finance leases, excluding loans and advances classified as held for sale, cash balances at central banks and other demand deposits, in accordance with the EBA/ITS/2019/02 Implementing Technical Standards amending Commission Implementing Regulation (EU) No 680/2014 with regard to the reporting of financial information (FINREP).
-
1.3 OPERATIONAL RISK
As of 31 December 2021, operational risk-weighted exposures represented EUR 46.8 billion, or 13% of the Group’s RWA, down -5% compared to the end of 2020 (EUR 49.2 billion). These weighted exposures are mainly determined using the internal model (95% of the total). Their variation is mainly due to the update of the scenario analyses, the costing of which may change downwards for certain categories of operational risk events.
-
1.4 MARKET RISK
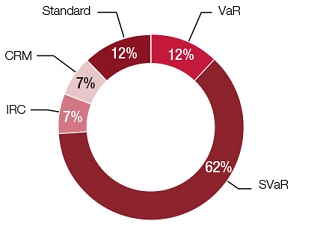
Market risk-weighted exposures are mainly determined using internal models (88% of the total at the end of 2021). These weighted exposures amounted to EUR 11.6 billion at the end of 2021, i.e. 3% of the Group’s total RWA, down -24% compared to the end of 2020 (EUR 15.3 billion).
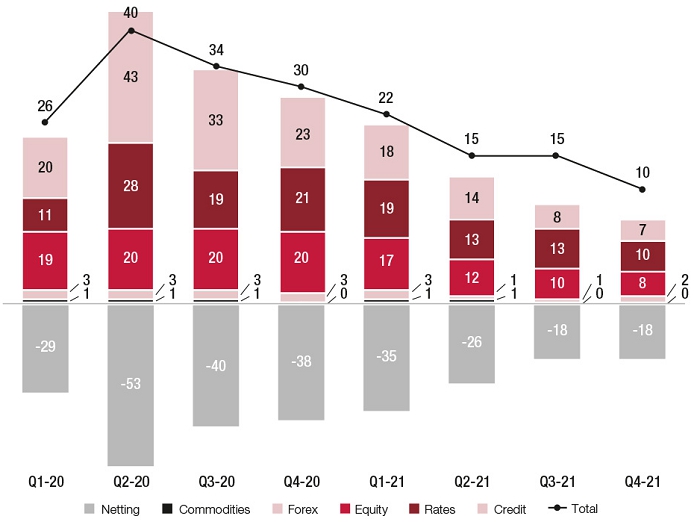
The drop in capital requirements for market risk is explained in particular by the continued decline in VaR in 2021 across all activities to reach historically low levels in the fourth quarter, the decrease in IRC and the CRM linked to the reduction of positions on debt instruments by the front office and by the fall in RWA calculated using the standard approach for interest rate risk.
-
1.5 LIQUIDITY RISK
The LCR (Liquidity Coverage Ratio) ratio stood at 129% at the end of 2021 (compared to 149% at the end of 2020), corresponding to excess liquidity of EUR 51 billion (compared to EUR 78 billion at the end of 2020), compared to a regulatory requirement of 100%. This change compared to 31 December 2020 is mainly due to strong commercial production activity combined with an increase in consumption of market activities impacting the securities inventory.
Liquidity reserves amounted to EUR 229 billion as of 31 December 2021 (compared to EUR 243 billion as of 31 December 2020). This variation is mainly due to a decrease in HQLA securities available for sale on the market (after discount), partially offset by an increase in central bank deposits (excluding mandatory reserves).
-
1.6 STRUCTURAL RISKS
The amount of sensitivity of the Group’s value to a rate change of +10 bps was EUR -20 million as of 31 December 2021 (compared to EUR +345 million as of 31 December 2020). The sensitivity of the Group’s net interest margin over the next three years is low. In the event of a parallel rise in yield curves of +10bp, it is positive and represents less than 1% of net banking income.
-
1.7 SIGNIFICANT OPERATIONS IN 2021
In 2021, the Group sold its asset management subsidiary Lyxor(1). This disposal is in line with Societe Generale’s strategy in terms of savings, which consists of operating in an open architecture and offering its clients investment and asset management solutions through partnerships with investment managers, external assets.
This sale generated a capital gain of EUR 0.4 billion as well as an impact of +18bps on the Group’s CET1 ratio and EUR -0.6 billion in RWA. Assets managed by Lyxor Asset Management totaled approximately EUR 140 billion at the end of December 2020, including EUR 124 billion within the scope of the transaction in question.
-
1.8 KEY FIGURES
(In EURm)
31.12.2021
30.09.2021
30.06.2021
31.03.2021
31.12.2020
AVAILABLE OWN FUNDS (AMOUNTS)
1
Common Equity Tier 1 (CET1) capital
49,835
47,752
48,315
47,082
47,290
2
Tier 1 capital
57,907
55,620
57,258
55,318
56,179
3
Total capital
68,487
66,432
69,331
66,858
67,584
RISK-WEIGHTED ASSETS (RWA)
4
Total risk-weighted assets
363,371
363,508
361,488
353,063
351,852
CAPITAL RATIOS (AS A PERCENTAGE OF RWA)
5
Common Equity Tier 1 ratio (%)
13.71%
13.14%
13.37%
13.34%
13.44%
6
Tier 1 ratio (%)
15.94%
15.30%
15.84%
15.67%
15.97%
7
Total capital ratio (%)
18.85%
18.28%
19.18%
18.94%
19.21%
ADDITIONAL OWN FUNDS REQUIREMENTS TO ADDRESS RISKS OTHER THAN THE RISK OF EXCESSIVE LEVERAGE (AS A PERCENTAGE OF RWA)(1)
EU 7a
Additional own funds requirements to address risks other than the risk of excessive leverage (%)
1.75%
1.75%
1.75%
1.75%
1.75%
EU 7b
of which to be made up of CET1 capital (%)
0.98%
0.98%
0.98%
0.98%
0.98%
EU 7c
of which to be made up of Tier 1 capital (%)
1.31%
1.31%
1.31%
1.31%
1.31%
EU 7d
Total SREP own funds requirements (%)
9.75%
9.75%
9.75%
9.75%
9.75%
COMBINED BUFFER REQUIREMENT (AS A PERCENTAGE OF RWA)
8
Capital conservation buffer (%)
2.50%
2.50%
2.50%
2.50%
2.50%
EU 8a
Conservation buffer due to macro-prudential or systemic risk identified at the level of a Member State (%)
-
-
-
-
-
9
Institution-specific countercyclical capital buffer (%)
0.04%
0.04%
0.04%
0.04%
0.04%
EU 9a
Systemic risk buffer (%)
-
-
-
-
-
10
Global Systemically Important Institution buffer (%)
1.00%
1.00%
1.00%
1.00%
1.00%
EU 10a
Other Systemically Important Institution buffer
-
-
-
-
-
11
Combined buffer requirement (%)
3.54%
3.54%
3.54%
3.54%
3.54%
EU 11a
Overall capital requirements (%)
13.29%
13.29%
13.29%
13.29%
13.29%
12
CET1 available after meeting the total SREP own funds requirements (%)
8.23%
7.65%
7.88%
(1)https://www.societegenerale.com/en/news/press-release/negotiation-with-Amundi-with-a-view-to-disposing-of-Lyxor-asset-management-activities.
(In EURm)
31.12.2021
30.09.2021
30.06.2021
31.03.2021
31.12.2020
LEVERAGE RATIO
13
Leverage ratio total exposure measure(2)
1,189,253
1,263,831
1,243,050
1,241,437
1,178,543
14
Leverage ratio
4.87%
4.40%
4.61%
4.46%
4.77%
ADDITIONAL OWN FUNDS REQUIREMENTS TO ADDRESS RISKS OF EXCESSIVE LEVERAGE (AS A PERCENTAGE OF TOTAL EXPOSURE MEASURE)
EU 14a
Additional own funds requirements to address the risk of excessive leverage (%)
-
-
-
EU 14b
of which to be made up of CET1 capital (%)
-
-
-
EU 14c
Total SREP leverage ratio requirements (%)(3)
3.09%
3.09%
3.09%
LEVERAGE RATIO BUFFER AND OVERALL LEVERAGE RATIO REQUIREMENT (AS A PERCENTAGE OF TOTAL EXPOSURE MEASURE)
EU 14d
Leverage ratio buffer requirement (%)
-
-
-
EU 14e
Overall leverage ratio requirements (%)(3)
3.09%
3.09%
3.09%
LIQUIDITY COVERAGE RATIO
15
Total high-quality liquid assets (HQLA) (Weighted value – average)
229,464
228,704
224,460
217,669
204,815
EU 16a
Cash outflows – Total weighted value
395,120
380,694
365,861
357,186
356,100
EU 16b
Cash inflows – Total weighted value
226,434
218,257
215,876
218,961
227,719
16
Total net cash outflows (adjusted value)
168,687
162,438
149,984
138,226
128,381
17
Liquidity coverage ratio (%)
135.95%
141.15%
151.41%
159.23%
160.14%
NET STABLE FUNDING RATIO
18
Total available stable funding
619,442
598,266
597,160
19
Total required stable funding
561,043
567,222
555,238
20
NSFR ratio (%)
110.41%
105.47%
107.55%
(1)From 1 March 2022 onwards, the own funds requirements applicable to Societe Generale group in relation to Pillar 2 will reach 2.12% (of which 1.19% in CET1), resulting in a total SREP own funds requirements of 10.12%.
(2)Over the whole historical period considered, the measurement of the leverage exposure has been taking into account the option to exempt temporarily some central bank exposures in accordance with the European regulation.
(3)The leverage ratio requirement applicable to Societe Generale group is 3.09% (enhancement of the initial regulatory requirement of 3% in relation to the abovementioned central bank exemption).
(in EURm)
TLAC
31.12.2021
30.09.2021
30.06.2021
31.03.2021
31.12.2020
OWN FUNDS AND ELIGIBLE LIABILITIES, RATIOS AND COMPONENTS(1)
1
Own funds and eligible liabilities
113,098
107,817
110,318
108,915
108,871
2
Total RWA of the Group
363,371
363,508
361,488
353,063
351,852
3
Own funds and eligible liabilities as a percentage of RWA
31.12%
29.66%
30.52%
30.85%
30.94%
4
Total exposure measure of the Group
1,189,253
1,263,831
1,243,050
1,241,437
1,178,543
5
Own funds and eligible liabilities as percentage of the total exposure measure
9.51%
8.53%
8.87%
8.77%
9.24%
6a
Does the subordination exemption in Article 72b(4) of the CRR apply? (5% exemption)
No
No
No
No
No
6b
Pro-memo item: Aggregate amount of permitted non-subordinated eligible liabilities in-struments If the subordination discretion as per Article 72b(3) CRR is applied (max 3.5% exemption)
6,921
5,571
5,910
7,300
8,289
6c
Pro-memo item: If a capped subordination exemption applies under Article 72b (3) CRR, the amount of funding issued that ranks pari passu with excluded liabilities and that is recognised under row 1, divided by funding issued that ranks pari passu with excluded Liabilities and that would be recognised under row 1 if no cap was applied (%)
100.00%
100.00%
100.00%
100.00%
100.00%
(1)With IFRS 9 phasing effect taken into account over the whole historical period considered.
As at 31 December 2021, the Group presents a TLAC ratio of 31.1% of risk-weighted assets (RWA) with the option of Senior preferred debt limited to 2.5% of RWA (the ratio being 29.2% without this option) for a regulatory requirement of 19.5%, and of 9.5% of the leverage exposure for a regulatory requirement of 6%.
-
2.1 TYPES OF RISKS
■credit risk: risk of losses arising from the inability of the Group’s customers, issuers or other counterparties to meet their financial commitments. This risk includes the risk linked to market transactions and securitisation activities and may be further amplified by individual, country and sector concentration risk;
■counterparty credit risk: Credit risk of a counterparty on a market transaction, combined with the risk of changes in exposure;
■market risk: risk of a loss of value on financial instruments arising from changes in market parameters, the volatility of these parameters and correlations between them. These parameters include, but are not limited to, exchange rates, interest rates, the price of securities (equity, bonds), commodities, derivatives and other assets;
■operational risk: risk of losses resulting from inadequacies or failures in processes, personnel or information systems, or from external events. It includes:
-non-compliance risk: risk of court-ordered, administrative or disciplinary sanctions, financial loss or reputational damage due to failure to comply with legal and regulatory requirements or professional/ethical standards and practices applicable to banking,
-reputational risk: risk arising from a negative perception on the part of customers, counterparties, shareholders, investors or regulators that could negatively impact the Group’s ability to maintain or engage in business relationships and to sustain access to sources of financing,
-misconduct risk: risk resulting from actions (or inactions) or behavior of the Bank or its employees inconsistent with the Group’s Code of Conduct, which may lead to adverse consequences for our stakeholders, or place the Bank’s sustainability or reputation at risk,
■structural risk: risk of losses in interest margin or banking book value if interest rates, exchange rates, or credit spreads change. This risk is related to the Bank’s commercial and proprietary activities, it includes the distortion of the structural difference between assets and liabilities related to pension obligations, as well as the risk related to longer terms of future payments;
■liquidity and funding risk: liquidity risk is defined as the inability of the Group to meet its financial obligations: debt repayments, collateral supply, etc. Funding risk is defined as the risk that the Group will not be able to finance its business growth on a scale consistent with its commercial objectives and at a cost that is competitive compared to its competitors;
■model risk: Risk of losses due to decisions reached based on results of internal modeling due to errors in development, implementation or use of these models;
■risk related to insurance activities: through its insurance subsidiaries, the Group is also exposed to a variety of risks linked to this business. In addition to balance sheet management risks (interest rate, valuation, counterparty and exchange rate risk), these risks include premium pricing risk, mortality risk and the risk of an increase in claims;
■strategic/business risk: risks resulting from the Group’s inability to execute its strategy and to implement its business plan for reasons that are not attributable to the other risks in this list; for instance, the non-occurrence of the macroeconomic scenarios that were used to construct the business plan or sales performance that was below expectations;
■residual value risk: through its specialized financing activities, mainly in its long-term vehicle leasing subsidiary, the Group is exposed to residual value risk (where the net resale value of an asset at the end of the leasing contract is less than expected);
■settlement/delivery risk: risk arising on market transactions in the case of transactions (commodities spot, OTC securities spot, Forex spot, OTC derivatives, Securities Financing Transactions, etc.) whose payment type is FoP (Free of Payment), inducing an asynchronous settlement/delivery of the flows to be paid and received.
-
2.2 RISK FACTORS
This section identifies the main risk factors that the Group estimates could have a significant effect on its business, profitability, solvency or access to financing.
The risks inherent to the Group’s business are presented below under six main categories, in accordance with Article 16 of the Regulation (EU) 2017/1129, also known as “Prospectus 3” regulation of 14 June 2017:
Risk factors are presented based on an evaluation of their materiality, with the most material risks indicated first within each category. The risk exposure or measurement figures included in the risk factors provide information on the Group’s exposure level but are not necessarily representative of any future evolution of these risks.
2.2.1 RISKS RELATED TO THE MACROECONOMIC, GEOPOLITICAL, MARKET AND REGULATORY ENVIRONMENTS
2.2.1.1 The global economic and financial context, geopolitical tensions, as well as the market environment in which the Group operates, may adversely affect its activities, financial position and results of operations.
As a global financial institution, the Group’s activities are sensitive to changes in financial markets and economic conditions generally in Europe, the United States and elsewhere around the world. The Group generates 49% of its business in France (in terms of net banking income for the financial year ended 31 December 2021), 32% in Europe, 7% in the Americas and 12% in the rest of the world. The Group could face significant deteriorations in market and economic conditions resulting from, in particular, crises affecting capital or credit markets, liquidity constraints, regional or global recessions, sharp fluctuations in commodity prices (notably oil), currency exchange rates or interest rates, inflation or deflation, rating downgrades, restructuring or defaults of sovereign or private debt, or adverse geopolitical events (including acts of terrorism and military conflicts). Such events, which can develop quickly and thus may not have been anticipated and hedged, could affect the Group’s operating environment for short or extended periods and have a material adverse effect on its financial position, cost of risk and results of operations.
The economic environment remains very uncertain despite the good performance of industry and world trade. Although initially rapid, the economic recovery was severely disrupted in 2021 by the effect of, firstly, production delays due to occasional factory closures, absenteeism due to illness, and shortages of labor, components (especially electronic components) and electricity in certain regions, and secondly, delays in transport deliveries due to, among other things, congestion in ports. In addition, the Russian-Ukrainian conflict starting in the beginning of 2022 has generated historically high tensions with Western countries, with significant potential impacts on global growth and energy prices and a humanitarian impact. These disruptions could persist in 2022 and have a significant impact on the activity and profitability of certain Group counterparties in 2022.
Disruptions in global supply chains, accompanied by tensions in the labour market, and rising energy prices are also leading to higher inflation, particularly in the United States, where a massive fiscal stimulus package has provided a strong boost to demand. Europe and emerging countries are also facing inflationary pressures. The longer the pandemic lasts, the more persistent these disruptions will be, with a potentially lasting impact on inflation, consumer purchasing power and ultimately on economic activity. The Russian-Ukrainian conflict is likely to accentuate some of these disruptions, particularly in Europe where, for example, natural gas prices have risen sharply and remain highly volatile.
The economic and financial environment remains exposed to intensifying geopolitical risks. Tensions between Russia and Western countries over the situation in Ukraine have increased significantly since mid-February 2022. The exceptional economic and financial sanctions put in place by a large number of countries, particularly in Europe and the United States, against Russia and Belarus could significantly affect operators with links to Russia, with a material impact on the Group’s risks (credit and counterparty, market, reputation, compliance, legal, operational, etc.). Based on the sanctions published on 27 February 2022, the Group’s local exposure to corporate and financial institution counterparties subject to sanctions is low at EUR 0.2 billion, and counterparties under sanctions account for approximately EUR 0.7 billion of the Group’s net off-shore exposure. Any new international sanction or Russian countermeasure could have an impact on the global economy and consequently on the Group’s risks. The Group will continue to analyse in real time the developments in the global impact of this crisis and, together, will enforce the necessary measures to comply with legislation in force and protect the Group’s franchise.
Uncertainty about the consequences of the situation in Ukraine makes it difficult to predict the impact on the global economy and the Group. Several scenarios remain conceivable for the Group. The estimated impact on the property rights on its banking assets in Russia would be of approximately -50 basis points of CET1 capital ratio based on Rosbank’s net book assets equivalent to EUR 2.1 billion at 31 December 2021, with EUR 0.5 billion of subordinated debt and taking into account the cancellation of the associated weighted assets.
This crisis could also exacerbate the already visible increase in prices and availability of hydrocarbons, as well as on the price of certain foodstuffs and metals. It could also generate strong volatility on the financial markets and a significant drop in the price of certain financial assets. In addition, the Russian government and certain Russian financial institutions could experience payment defaults, with consequences that are difficult to anticipate for the Group.
As of 31 December 2021, EAD exposures on Russia represented 1.7% of the Group’s exposure to credit and counterparty risks, i.e. EUR 18.6 billion (of which EUR 15.4 billion on its subsidiary Rosbank) and EUR 3.2 billion of off-shore exposures, mainly consisting of transactions set up as part of the financing activities of the Corporate and Investment Banking division). In 2021, activities located in Russia represented 2.8% of the Group’s net banking income and 2.7% of its net income. In addition, Société Générale has a minor exposure in Ukraine (less than EUR 80 million at 31 December 2021), mainly through its subsidiary ALD. See also section 2.10 “Post-closing events” of the 2022 Universal Registration Document.
Furthermore, the U.S.-China confrontation brings with it trade tensions and the risk of a technological fragmentation. In Africa, a series of political coups in the Sahel region has heightened awareness of the fragility of the institutional frameworks of countries exposed to terrorism.
Continued high geopolitical risks are an additional source of instability that could also weigh on economic activity and credit demand, while increasing volatility in financial markets. In the context of Brexit, the topic of non-equivalence of clearing houses (central counterparties, or CCPs) remains a point of vigilance, with possible impacts on financial stability, notably in Europe, and therefore on the Group’s business.
Over the last decade, the financial markets have thus experienced significant disruptions resulting notably from concerns over the evolution of central bank interest rate policies, the trajectory of the sovereign debt of several Eurozone countries, Brexit, the persistence of commercial and political tensions (namely between the United States and China) or fears of a major slowdown of growth in China, fostered again recently by the financial difficulties of Chinese real estate development companies, the disruption of value and supply chains caused by the Covid-19 crisis or more recently by the tensions linked to the crisis in Ukraine. Given the magnitude of external financing needs, several emerging countries would face increasing difficulties if U.S. interest rates were to rise, and their financial conditions were to tighten.
The long period of low interest rates in the Eurozone and the United States, driven by accommodating monetary policies, has affected the Group’s net interest margin for several years. Growth in the volume of loans made to non-financial companies, already high before the pandemic, significantly increased in 2020 with the implementation of government-guaranteed loan programmes (such as the Prêt Garanti par l’Etat programme in France). In 2021, this growth has slowed with the repayment of a part of the credit lines drawn in 2020. Should an overly fragile economic recovery materialise, it may provoke a rise in the volume of non-performing loans and create a weak investment dynamic in a context where companies’ balance sheets are already fragile. The environment of low interest rates tends to lead to an increased risk appetite of some participants in the banking and financial system, lower risk premiums compared to their historical average and high valuation levels of certain assets. These market conditions could change rapidly in the event of a more rapid increase in key interest rates by the major central banks, which could cause a marked correction in asset prices.
Furthermore, the environment of abundant liquidity that has been at the origin of the upturn in credit growth in the Eurozone and particularly in France, amplified by the implementation of the French government-guaranteed loan programme, could lead in the future to additional regulatory measures by supervisory authorities in order to limit the extension of credit or to further protect banks against a financial cycle downturn.
The Group’s results are thus significantly exposed to economic, financial, political and geopolitical conditions in the principal markets in which it operates.
Furthermore, the situation related to the Covid-19 crisis is a further aggravating factor in the various risks faced by the Group. See also section 2.2.1.2 “The coronavirus (Covid-19) pandemic and its economic consequences could adversely affect the Group’s business and financial performance”.
At 31 December 2021, the Group’s EAD to credit and counterparty risks were concentrated in Europe and the United States (together accounting for 90%), with a predominant exposure to France (46% of EAD). The other exposures concern Western Europe excluding France (accounting for 21%), North America (accounting for 14%), Eastern European members of the European Union (accounting for 7%) and Eastern Europe excluding the European Union (accounting for 2%).
In France, the Group’s principal market, the good growth performance during the 2016-2019 period and low interest rates have fostered an upturn in the housing market. A reversal of activity in this area could have a material adverse effect on the Group’s asset value and business, by decreasing demand for loans and resulting in higher rates of non-performing loans.
The Group also operates in emerging markets, such as Russia or Africa and the Middle East (5% of the Group’s credit exposure). A significant adverse change in the macroeconomic, health, political or financial environment in these markets could have a material adverse effect on the Group’s business, results and financial position. These markets may be adversely affected by uncertainty factors and specific risks, such as a new increase in oil and natural gas prices, which would weigh on the financial position of importing countries as well as their growth and exchange rates. The correction of macroeconomic or budgetary imbalances that would result could be imposed by the markets with an impact on growth and on exchange rates. A major source of uncertainty currently comes from the ongoing conflict in Ukraine and its humanitarian, economic and financial consequences. In the longer term, the energy transition to a “low-carbon economy” could adversely affect fossil energy producers, energy-intensive sectors of activity and the countries that depend on them. In addition, capital markets (including foreign exchange activity) and securities trading activities in emerging markets may be more volatile than those in developed markets and may also be vulnerable to certain specific risks, such as political instability and currency volatility. These elements could negatively impact the Group’s activity and results of operations.
2.2.1.2 The coronavirus pandemic (Covid-19) and its economic consequences could adversely affect the Group’s business and financial performance.
In December 2019, a new strain of coronavirus (Covid-19) emerged in China. The virus has since spread to numerous countries around the world, with a high concentration of cases in certain countries where the Group operates. The World Health Organization declared the outbreak of a pandemic in March 2020. The Covid-19 pandemic and the health measures taken in response to it (border closures, lockdown measures, restrictions on certain economic activities, etc.) have had and may continue to have a significant impact, both direct and indirect, on the global economic situation and financial markets.
The deployment of vaccination programmes has reduced the risk of severe illness from Covid-19 infections among the vaccinated population and the need for strict lockdowns in the event of high virus circulation in countries where vaccines have been deployed on a large scale. The persistence of the pandemic and the emergence of new variants (such as the highly transmissible Omicron variant) have led, and may again lead, to new targeted restrictive measures or an increase in absenteeism and work stoppages, exacerbating the disruptions already present in global supply chains, and thus adversely affecting the Group’s business, financial performance and results.
The impact of the crisis related to the Covid-19 will also have lasting consequences that remain difficult to be assessed, notably through the loss of human capital (loss of skills due to long periods of inactivity, lower quality of training, etc.) and increasing public and corporate debts.
The different restrictive measures had also led, especially in the beginning of the sanitary crisis, to a decline in the Group’s commercial activity and results due to the reduced opening of its retail network and lower demand from its customers, despite a rapid adaptation. New phases of lockdown measures or curfews in the countries where the Group operates could again impact the Group’s financial results.
In many jurisdictions in which the Group operates, national governments and central banks have taken or announced exceptional measures to support the economy and its actors (government-guaranteed loan facilities programmes, tax deferrals, facilitated recourses to part-time working, compensation, etc.) or to improve liquidity in financial markets (asset purchases, etc.). While these support measures have been effective in addressing the immediate effects of the crisis, the mechanisms put in place may not be sufficient to sustain the recovery over the long term.
The various restrictive measures implemented since the beginning of the pandemic in several of the main countries where the Group operates (with Western Europe representing 67% of the Group’s EAD (Exposure at Default) at 31 December 2021, of which 46% was in France) have had a significant impact on economic activity. The risk of new restrictive measures (especially in the event of new pandemic waves) as well as a slower-than-expected recovery of demand (particularly in certain economic sectors) could increase the economic difficulties resulting from the health crisis. This, combined with a high level of public and corporate indebtedness, may constitute a brake on economic growth and lead to significant adverse repercussions on the credit quality of the Group’s counterparties (affected in particular by the gradual cessation of government support measures or by difficulties in extending these measures) and the level of non-performing loans for both businesses and individuals.
2020 was characterised by a significant increase in the cost of risk, mainly due to the provisioning for Stages 1 and 2 in anticipation of future defaults. In 2021, the net cost of risk was low in the absence of default, while the Group continued to maintain a provisioning policy for Stages 1 and 2 in the event that defaults begin to materialise. The Group’s cost of risk could be affected in future years by its participation in the French government-guaranteed loan programmes (in respect of the unguaranteed residual exposure) on which the observed defaults remain to be quantified.
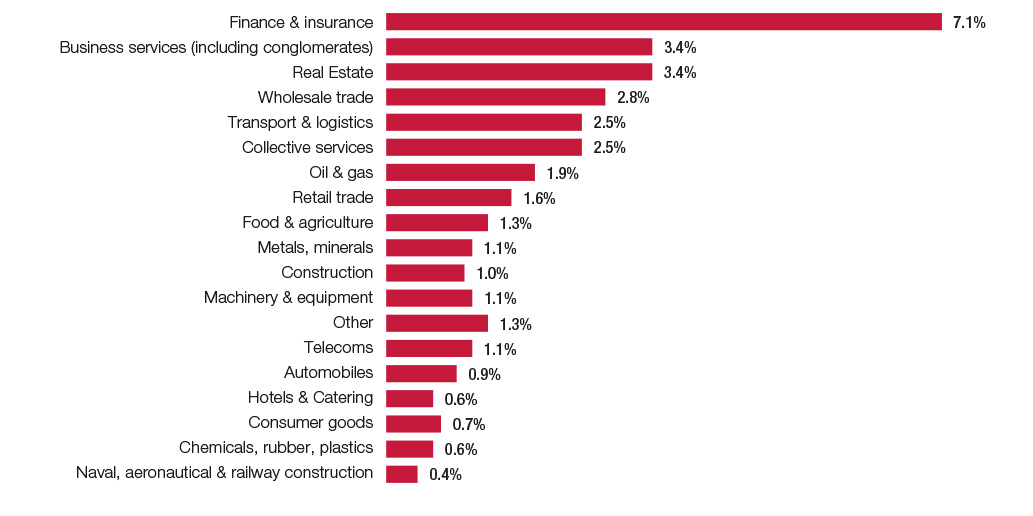
Within the Corporate portfolio, at 31 December 2021, the most impacted sectors were the automotive sector (0.9% of the Group’s total exposure), hotels, catering and leisure (0.6% of the Group’s total exposure), non-food retail distribution (the entirety of the retail distribution sector represents 1.6% of the Group’s total exposure) and air transport (less than 0.5% of the Group’s total exposure).
The Group’s results and financial position were affected by unfavourable developments in global financial markets due to the Covid-19 crisis, especially in March and April 2020 (extreme volatility and dislocation of term structure, alternate sharp declines and rapid rebounds in the equity markets, widening of credit spreads, unprecedented declines in, or cancellation of, dividend distributions, etc.). These exceptional conditions have particularly affected the management of structured equity-linked products. Since then, these activities have been thoroughly reconsidered to improve and reduce the risk profile. Although monetary and fiscal stimuli — as well as medical advances — have supported economies and financial markets, the Group remains attentive to the risk of correction that could occur in particular in the event of new epidemic waves.
For information purposes, risk-weighted assets (RWA) related to market risks were thus down 24% at the end of December 2021 compared to the situation at the end of December 2020, to EUR 11.6 billion. The Global Markets and Investor Services sector, which mainly concentrates the Group’s market risks, represented a net banking income of EUR 5.6 billion, or 22% of the Group’s total revenues in 2021.
Restrictive measures have led the Group to massively implement remote working arrangements, particularly for a significant part of its market activities. This organisation, which was deployed in immediate response to the crisis, increases the risk of operational incidents and the risk of cyber-attacks. Even though the Group has put in place adaptation and support measures, these risks remain higher in periods of widespread recourse to remote working. All employees remain subject to health risks at the individual level. Prolonged remote working also increases psychosocial risk, with potential impacts in terms of organisation and business continuity in the event of prolonged absences.
The unprecedented environment resulting from the Covid-19 crisis could alter the performance of the models used within the Group (particularly in terms of asset valuation and assessment of own funds requirements for credit risk), due in particular to calibration carried out over periods that are not comparable to the current crisis or to assumptions that are no longer valid, taking the models beyond their area of validity. The temporary decline in performance and the recalibration of these models could have an adverse impact on the Group’s results.
The ECB recommendation to restrict dividend distribution and share buybacks for all banks placed under its direct supervision expired on 30 September 2021. As from this date, dividend distribution and share buybacks policies will be determined in accordance with the provisions of the applicable prudential regulation.
Uncertainty as to the duration and impact of the Covid-19 pandemic makes it difficult to predict its impact on the global economy. Consequences for the Group will depend on the duration of the pandemic, the measures taken by national governments and central banks and developments in the health, economic, financial and social context.
2.2.1.3 The Group’s failure to achieve its strategic and financial objectives disclosed to the market could have an adverse effect on its business, results of operations and the value of its financial instruments.
At the time of the publication of its annual results on 10 February 2022, the Group communicated new guidance on its operating expenses, cost of risk and solvency. The Group targets an underlying cost/income ratio (excluding the Single Resolution Fund - SRF) between 66% and 68% in 2022 and with further improvement thereafter. Over 2022, the Group’s cost of risk should not exceed 30 basis points. In consideration of the situation in Ukraine, the Group communicated on 3 March 2022 that it was not changing its cost-of-risk target and that it would update it, if necessary, at the time of its Q1 2022 results publication. The Group manages its CET1 ratio with a margin of flexibility of between 200 and 250 basis points higher than regulatory requirements, defined as the Maximum Distributable Amount (MDA), including under Basel IV.
These expectations are based on a number of assumptions related to the macroeconomic, geopolitical and health context. The non-occurrence of these assumptions (including in the event of the occurrence of one or more of the risks described in this section) or the occurrence of unanticipated events could compromise the achievement of Group’s strategic and financial objectives and negatively affect its activity, results and financial situation.
More precisely, the Group’s “Vision 2025” project anticipates the merger between the Retail Banking network of Société Générale in France and Crédit du Nord. Although this project has been designed to enable a controlled deployment, the merger could have a short-term material adverse effect on the Group’s business, financial position and costs. System reconciliations could face delays, delaying part of the expected merger benefits. The project could lead to the departure of a number of employees, requiring replacements and efforts related to new employee training, thus potentially generating additional costs. The merger could also lead to the departure of a portion of the Group’s customers, resulting in loss of revenue. The legal and regulatory aspects of the transaction could result in delays or additional costs. In October 2021, the Group presented the detailed “Vision 2025” project, specifying that the timetable and ambitions remained aligned with the initial presentation of the project. In addition, the effective sale of Lyxor was finalised on 31 December 2021. The Group also announced the signature by Société Générale and ALD of two memoranda of understanding providing for the acquisition by ALD of 100% of LeasePlan, with a view to creating a global leader in sustainable mobility solutions. The Group also announced on 1 February 2022 that Boursorama had signed a memorandum of understanding with ING. Under this agreement, exclusive new customer offers, and a simplified subscription process (depending on the product) are expected to be proposed to ING customers who wish to become Boursorama customers.
The Group may however face an execution risk on these strategic projects, which are to be carried out simultaneously. Any difficulty encountered during the process of integrating activities (particularly from a human resource standpoint) is likely to result in higher integration costs and lower-than-anticipated savings, synergies or benefits. Moreover, the process of integrating the acquired operational businesses into the Group could disrupt the operations of one or more of its subsidiaries and divert management’s attention, which could have a negative impact on its business and results. These acquisitions may not materialise, in whole or in part, resulting in a reduced level of expected earnings.
Furthermore, the Group is committed to becoming a leading bank in the field of responsible finance through, among others:
■more than EUR 150 billion in financing granted to support the energy transition, above the 2019-2023 target of EUR 120 billion, two years ahead of schedule;
■strong targets for decarbonizing the Group’s portfolios, including a planned total exit from thermal coal and a 10% reduction in the Group’s overall exposure to the oil and gas extraction sector (upstream) by 2025;
■the signing as co-founder of the Principles for a Responsible Banking Sector, through which the Group undertakes to strategically align its business with the Sustainable Development Objectives set by the United Nations and the Paris Agreement on Climate Change;
■a key role as a founding member of the Net-Zero Banking Alliance initiative, with a commitment to align its portfolios on trajectories aimed at global carbon neutrality by 2050 in order to reach the objective of limiting global warming to 1.5°C.
These measures (and additional measures that may be taken in the future) could in some cases affect decrease the Group’s results in the sectors concerned.
2.2.1.4 The Group is subject to an extended regulatory framework in each of the countries in which it operates and changes to this regulatory framework could have a negative effect on the Group’s businesses, financial position and costs, as well as on the financial and economic environment in which it operates.
The Group is subject to the regulations of the jurisdictions in which it operates. French, European and U.S. regulations as well as other local regulations are concerned, given the cross-border activities of the Group, among other factors. The application of existing regulations and the implementation of future regulations requires significant resources that could affect the Group’s performance. In addition, possible non-compliance with regulations could lead to fines, damage to the Group’s reputation, forced suspension of its operations or the withdrawal of operating licences. By way of illustration, exposures to credit and counterparty risks (EAD) in France, the 27-member European Union (including France) and the United States represented 46%, 67% and 14%, respectively as of 31 December 2021.
■several regulatory changes are still likely to degrade the environment for market activities: (i) the possible strengthening of transparency constraints and investor protection measures (review of MiFID II/MiFIR, IDD, ELTIF (European Long-Term Investment Fund Regulation), (ii) the implementation of the fundamental review of the trading book, or FRTB, which may significantly increase requirements applicable to European banks and (iii) despite the European Commission’s decision of 8 February 2022 to extend the equivalence granted to UK central counterparties until 30 June 2025, possible relocations could be requested;
■in the United States, the implementation of the Dodd-Frank Act has been almost finalised. The new Securities and Exchange Commission (SEC) regulations related to security-based swap dealers have been applicable since 2021 and requires Société Générale’s registration with the SEC as a Securities Based Swap Dealer and compliance with related regulations. Further, once the SEC has issued a final order on substituted compliance for France, a portion of the SEC’s rules could be satisfied by demonstrating compliance with home country laws;
■European measures aimed at restoring banks’ balance sheets, especially through active management of non-performing loans (“NPLs”), which are leading to a rise of prudential requirements and an adaptation of the Group’s strategy for managing NPLs. More generally, additional measures to define a framework of good practices for granting (e.g., loan origination orientations published by the European Banking Authority) and monitoring loans could also impact the Group;
■the strengthening of data quality and protection requirements and a potential strengthening of cyber-resilience requirements in relation to the publication on 24 September 2020 of the proposed European regulation on digital operational resilience for the financial sector;
■the implementation of the European sustainable finance regulatory framework, with an increase in non-financial reporting obligations, enhanced inclusion of environmental, social and governance issues in risk management activities and the potential inclusion of such risks in the supervisory review and assessment process (Supervisory Review and Evaluation Process, or SREP);
■the strengthening of the crisis prevention and resolution regime set out in the Bank Recovery and Resolution Directive of 15 May 2014 (“BRRD”), as revised, gives the Single Resolution Board (“SRB”) the power to initiate a resolution procedure towards a credit institution when the point of non-viability is considered reached. In this context, the SRB could, in order to limit the cost to the taxpayer, force some creditors and the shareholders of the Group to incur losses in priority. Should the resolution mechanism be triggered, the Group could, in particular, be forced to sell certain of its activities, modify the terms and conditions of the remuneration of its debt instruments, issue new debt instruments, or be subjected to a depreciation of its debt instruments or their conversion into equity securities. Furthermore, the Group’s contribution to the annual financing of the Single Resolution Fund (“SRF”) is significant and will grow steadily until 2023, with 2024 being the year of the full endowment of the fund. The contribution to the banking resolution mechanisms is described in Note 7.3.2 “Other provisions for risks and expenses” of the 2022 Universal Registration Document.
■the ongoing implementation in France of consumer and social-oriented measures affecting retail banking (limitation of banks’ fees for individuals and extension of such measures to small and medium-sized businesses, and protection measures for vulnerable customers);
■the potential requirement at the European level to open more access to banking data (savings books, investments) to third-party service providers and/or to pool customer data;
■new obligations arising from a package of proposed measures announced by the European Commission on 20 July 2021 aiming to strengthen the European supervisory framework around the fight against money laundering and terrorist financing, as well as the creation of a new European agency to fight money laundering;
■new measures arising from changes to bankruptcy laws relating to the management of the health crisis caused by the Covid-19 pandemic, including those facilitating recourse to accelerated safeguard procedures;
■new requirements resulting from the EU banking regulation reform proposal presented on 27 October 2021 by the European Commission. The reform consists of several legislative instruments to amend the directive on capital requirements (European Parliament and EU Council, directive 2013/36/EU, 26 June 2013) as well as the regulation on capital requirements (CRR) (European Parliament and EU Council, regulation (EU) No. 575/2013, 26 June 2013).
The Group is also subject to complex tax rules in the countries where it operates. Changes in applicable tax rules, uncertainty regarding the interpretation of certain evolutions or their effects may have a negative impact on the Group’s business, financial position and costs.
Moreover, as an international bank that handles transactions with US persons, denominated in US dollars, or involving US financial institutions, the Group is subject to US regulations relating in particular to compliance with economic sanctions, the fight against corruption and market abuse. More generally, in the context of agreements with US and French authorities, the Group has undertaken to implement, through a dedicated programme and a specific organisation, corrective actions to address identified deficiencies and strengthen its compliance programme. In the event of a failure to comply with relevant US regulations, or a breach of the Group’s commitments under these agreements, the Group could be exposed to the risk of (i) administrative sanctions, including fines, suspension of access to US markets, and even withdrawals of banking licences, (ii) criminal proceedings, and (iii) damage to its reputation.
2.2.1.5 Increased competition from banking and non-banking operators could have an adverse effect on the Group’s business and results, both in its French domestic market and internationally.
Due to its international activity, the Group faces intense competition in the international and local markets in which it operates, whether from banking or non-banking actors. As such, the Group is exposed to the risk of not being able to maintain or develop its market share in its various activities. This competition may also lead to pressure on margins, which would be detrimental to the profitability of the Group’s activities.
Consolidation in the financial services industry could result in the competitors benefiting from greater capital, resources and an ability to offer a broader range of financial services. In France and in the other main markets where the Group operates, the presence of major domestic banking and financial actors, as well as new market participants (notably neo-banks and online financial services providers), has increased competition for virtually all products and services offered by the Group. New market participants such as “fintechs” and new services that are automated, scalable and based on new technologies (such as blockchain) are developing rapidly and are fundamentally changing the relationship between consumers and financial services providers, as well as the function of traditional retail bank networks. Competition with these new actors could be exacerbated by the emergence of substitutes for central bank currency (crypto-currencies, digital central bank currency, etc.).
Moreover, competition is also enhanced by the emergence of non-banking actors that, in some cases, may benefit from a regulatory framework that is more flexible and in particular less demanding in terms of equity capital requirements.
To address these challenges, the Group has implemented a strategy, in particular with regard to the development of digital technologies and the establishment of commercial or equity partnerships with these new actors (such as Lumo, the platform offering green investments, or Shine, the neobank for professionals). In this context, additional investments may be necessary for the Group to be able to offer new innovative services and to be competitive with these new actors. This intensification of competition could, however, adversely affect the Group’s business and results, both on the French market and internationally.
2.2.1.6 Environmental, social and governance (ESG) risks, in particular related to climate change, could have an impact on the Group’s activities, results and financial situation in the short-, medium- and long-term.
Environmental, social and governance (ESG) risks are defined as risks stemming from the current or prospective impacts of ESG factors on counterparties or invested assets of financial institutions. ESG risks are seen as aggravating factors to the traditional categories of risks (credit and counterparty risk, market and structural risk, operational risk, reputational risk, compliance risk, liquidity and funding risk, risks related to insurance activities) and are likely to impact the Group’s activities, results and financial position in the short-, medium- and long-term.
The Group is thus exposed to environmental risks, and in particular climate change risks through its financing, investment and service activities. Concerning climate risks, a distinction is made between (i) physical risk, with a direct impact on entities, people and property stemming from climate change and the multiplication of extreme weather events; and (ii) transition risk, which results from the process of transitioning to a low-carbon economy, such as regulatory or technological disruptions or changes in consumer preferences.
The Group could be exposed to physical risk resulting from a deterioration in the credit quality of its counterparties whose activity could be negatively impacted by extreme climatic events or long-term gradual changes in climate, and through a decrease in the value of collateral received (particularly in the context of real estate financing). The Group’s insurance activities could also be impacted with exposure in regions and countries that are particularly vulnerable to climate change.
The Group may also be exposed to transition risk through its credit portfolio in a limited number of sensitive sectors that are subject to more stringent regulations or due to technological disruptions, and may be exposed to reputation risk in the event it does not comply with its commitments in favor of environmental transition or if these commitments are considered insufficient by its stakeholders.
Beyond the risks related to climate change, risks more generally related to environmental degradation (such as the risk of loss of biodiversity) are also aggravating factors to the Group’s risks. The Group could notably be exposed to credit risk on a portion of its portfolio, linked to lower profitability of some of its counterparties due, for example, to a significant decline in revenues following changes in customer behavior or to increasing legal and operating costs (for instance due to the implementation of new environmental standards).
In addition, the Group is exposed to social risks, related for example to non-compliance by some of its counterparties with labor rights or workplace health and safety issues, which may trigger or aggravate non-compliance, reputational and credit risks for the Group.
Similarly, risks relating to governance of the Group’s counterparties and stakeholders (suppliers, service providers, etc.), such as an inadequate management of environmental and social issues or non-compliance with corporate governance codes related to, among others, anti-money laundering issues, could generate credit and reputational risks for the Group.
Beyond the risks related to its counterparties or invested assets, the Group could also be exposed to risks related to its own activities. Therefore, the Group is exposed to physical climate risk with respect to its ability to maintain its services in geographical areas impacted by extreme events (floods, etc.).
The Group also remains exposed to specific social and governance risks, relating for example to compliance with labor laws, the management of its human resources and ethical issues, transparency or the composition (such as in terms of diversity) of its Board of Directors or staff.
All of these risks could have an impact on the Group’s business, results and reputation in the short-, medium- and long-term.
2.2.1.7 The Group is subject to regulations relating to resolution procedures, which could have an adverse effect on its business and the value of its financial instruments.
The BRRD and Regulation (EU) No. 806/2014 of the European Parliament and of the Council of the European Union of 15 July 2014 (the Single Resolution Mechanism, or “SRM”) define an European Union-wide framework for the recovery and resolution of credit institutions and investment firms. The BRRD provides the authorities with a set of tools to intervene early and quickly enough in an institution considered to be failing so as to ensure the continuity of the institution’s essential financial and economic functions while reducing the impact of the failure of an institution on the economy and the financial system (including the exposure of taxpayers to the consequences of the failure). Under the SRM Regulation, a centralised resolution authority is established and entrusted to the SRB and national resolution authorities. The powers granted to the resolution authority under the BRRD and the SRM Regulations include write-down/conversion powers to ensure that capital instruments and eligible liabilities absorb the Group’s losses and recapitalise it in accordance with an established order of priority (the “bail-in tool”). Subject to certain exceptions, losses are borne first by the shareholders and then by the holders of additional Tier 1 and Tier 2 capital instruments, then by the non-preferred senior debt holders and finally by the senior preferred debt holders, all in the order of their claims in a normal insolvency proceeding. The conditions for resolution provided by the French Monetary and Financial Code implementing the BRRD are deemed to be met if: (i) the resolution authority or the competent supervisory authority determines that the institution is failing or likely to fail; (ii) there is no reasonable perspective that any measure other than a resolution measure could prevent the failure within a reasonable timeframe; and (iii) a resolution measure is necessary to achieve the resolutions’ objectives (in particular, ensuring the continuity of critical functions, avoiding a significant negative effect on the financial system, protecting public funds by minimizing the recourse to extraordinary public financial support, and protecting customers’ funds and assets) and the winding up of the institution under normal insolvency proceedings would not meet these objectives to the same extent.
The resolution authority could also, independently of a resolution measure or in combination with a resolution measure, proceed with the write-down or conversion of all or part of the Group’s capital instruments (including subordinated debt instruments) into equity if it determines that the Group will no longer be viable unless it exercises this write-down or conversion power or if the Group requires extraordinary public financial support (except where the extraordinary public financial support is provided in the form defined in Article L. 613-48 III, 3° of the French Monetary and Financial Code).
The bail-in tool could result in the write-down or conversion of capital instruments in whole or in part into ordinary shares or other ownership instruments.
In addition to the bail-in tool, the BRRD provides the resolution authority with broader powers to implement other resolution measures with respect to institutions that meet the resolution requirements, which may include (without limitation) the sale of the institution’s business segments, the establishment of a bridge institution, the split of assets, the replacement or substitution of the institution as debtor of debt securities, changing the terms of the debt securities (including changing the maturity and/or amount of interest payable and/or the imposition of a temporary suspension of payments), the dismissal of management, the appointment of a provisional administrator and the suspension of the listing and admission to trading of financial instruments.
Before taking any resolution action, including the implementation of the bail-in tool, or exercising the power to write down or convert relevant capital instruments, the resolution authority must ensure that a fair, prudent and realistic valuation of the institution’s assets and liabilities is made by a third party independent of any public authority.
The application of any measure under the French implementing provisions of the BRRD or any suggestion of such application to the Group could have a material adverse effect on the Group’s ability to meet its obligations under its financial instrument and, as a result, holders of these securities could lose their entire investment.
In addition, if the Group’s financial condition deteriorates, the existence of the bail-in tool or the exercise of write-down or conversion powers or any other resolution tool by the resolution authority (independently of or in combination with a resolution) if it determines that Société Générale or the Group will no longer be viable could result in a more rapid decline in the value of the Group’s financial instruments than in the absence of such powers.
-
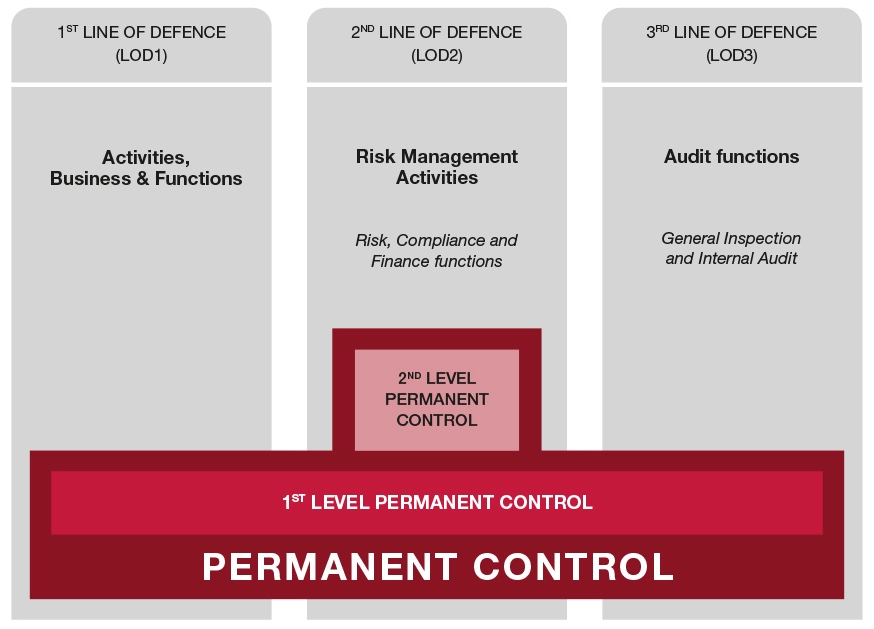
3.1 SUITABILITY OF RISK MANAGEMENT SYSTEMS
The Pillar 3 report, published under the responsibility of Societe Generale Group’s Senior Management, sets out, in accordance with the CRR regulation, the quantitative and qualitative information on Societe Generale’s capital, liquidity and risk management to ensure transparency in respect of the various market players. This information has been prepared in compliance with the internal control procedures approved by the Board of Directors in the course of the validation of the Group Risk Appetite Framework and Group Risk Appetite Statement, and are based, among other things, on the annual review, by General Management in the Group Internal Control Coordination Committee (GICCC) and by the Risk Committee of the Board of Directors, of Societe Generale’s Risk division, particularly in its ability to exercise its role as the second line of defense for the entire Group.
-
3.2 RISK APPETITE
Risk appetite is defined as the level of risk that the Group is prepared to accept to achieve its strategic and financial goals.
The Group’s ambition is to push ahead with sustainable development based on a diversified and balanced banking model with a strong European anchor and a targeted global presence in selected areas of strong business expertise. The Group also wishes to maintain long-term relationships with its clients built on the mutual confidence deserved and to meet the expectations of all of its stakeholders by providing them with responsible and innovative financial solutions.
■an organisation with 16 Business Units offering various products and services to the Group’s clients in different geographic locations;
-a preponderance of retail banking activities in France and abroad, which currently represent around 60% of risk weighted assets (“RWA”) of the Group,
-limitation of Business Unit Global Markets’ share in the RWA of the Group. In accordance with its client-focused development strategy, the Group ceased its trading activities for its own account(1) in 2019, and finalised its project to simplify the products processed in 2021,
-non-bank services activities, in particular Insurance and vehicle fleet management and financing, are conducted in line with the business strategy; they demonstrate a disciplined risk profile and thus generate profitability compliant with the Group’s expectations;
-in Retail Banking, the Group focuses on international development leveraging historic presence, extensive market knowledge and top-tier positions,
-as regards Global Banking and Investor Solutions, apart from historical establishments, the Group targets activities for which it can leverage international expertise;
■a targeted growth policy, favoring existing areas of expertise, a sound quality business fund and the search for synergies in the diversified banking model;
■a positive and sustainable contribution to the transformations of our economies, in particular with regard to the technological revolution, and economic, social and environmental transitions; CSR concerns are therefore at the heart of its strategy and the Group’s relationships with stakeholders;
■a strong vigilance as regards its reputation, deemed by the Group to be a high-value asset which must be protected.
(1)In accordance with French Banking Law, the few residual trading activities of the Group unrelated to clients were isolated in a dedicated subsidiary called Descartes Trading.
The Group seeks to achieve sustainable profitability, relying on a robust financial profile consistent with its diversified banking model, by:
■maintaining a target rating allowing access to financial resources at a cost consistent with the development of the Group’s businesses and its competitive positioning;
-compliance with the financial conglomerate ratio which considers the combined solvency of the Group’s banking and insurance activities,
-a sufficient level of creditor protection consistent with a debt issuance program that is particularly hybrid consistent with the Group’s objectives in terms of rating and regulatory ratios such as Tier 1, TLAC (“Total Loss Absorbing Capacity”), MREL (“Minimum Required Eligible Liabilities”), and the leverage ratio;
■ensuring resilience of its liabilities, which are calibrated by taking into account a survival horizon in a liquidity stress ratio, compliance with LCR (Liquidity Coverage Ratio) and NSFR (Net Stable Funding Ratio) regulatory ratios and the level of dependence on short-term fundings and the foreign exchange needs of the Group’s businesses, particularly in dollars;
Credit risk appetite is managed through a system of credit policies, risk limits and pricing policies.
When it takes on credit risk, the Group focuses on medium- and long-term client relationships, targeting both clients with which the Bank has an established relationship of trust and prospects representing profitable business development potential over the mid-term.
Acceptance of any credit commitment is based on in-depth client knowledge and a thorough understanding of the purpose of the transaction.
In a credit transaction, risk acceptability is based first on the borrower’s ability to meet its commitments, in particular through the cash flows which will allow the repayment of the debt. For medium and long-term operations, the funding duration must remain compatible with the economic life of the financed asset and the visibility horizon of the borrower’s cash flow.
Security interests are sought to reduce the risk of loss in the event of a counterparty defaulting on its obligations, but may not, except in exceptional cases, constitute the sole justification for taking the risk. Security interests are assessed with prudent value haircuts and paying special attention to their actual enforceability.
Complex transactions or those with a specific risk profile are handled by specialised teams within the Group with the required skills and expertise.
The Group seeks risk diversification by controlling concentration risk and maintaining a risk allocation policy through risk sharing with other financial partners (banks or guarantors).
Counterparty ratings are a key criterion of the credit policy and serve as the basis for the credit approval authority grid used in both the commercial and risk functions. The rating framework relies on internal models. Special attention is paid to timely updating of ratings (which, in any event, are subject to annual review(1)).
The risk measure of the credit portfolio is based primarily on the Basel parameters that are used to calibrate the capital need. As such, the Group favors the so-called advanced Basel models (IRBA), which are more risk-sensitive and more adapted to the specific characteristics of the bank’s portfolio. These measures are complemented by an internal stress-sized risk assessment, either at the global portfolio level or at the sub-portfolio level, linking risk measures and rating migration to macro-economic variables. In addition, the calculation of expected losses under the provisions of IFRS 9, used to determine the level of impairment on healthy outstandings, provides additional insight into assessing portfolio risk.
In consultation with the Risk Department, the businesses implement, most of the time, pricing policies that are differentiated according to the level of risk of counterparties and transactions. The purpose of pricing a transaction is to ensure acceptable profitability, in line with the objectives of ROE (Return on Equity) of the business or entity, after taking into account the cost of the risk of the transaction in question. The pricing of an operation can nevertheless be adapted in certain cases to take into account the overall profitability and the potential customer relationship development. The intrinsic profitability of products and customer segments is subject to periodic analysis in order to adapt to changes in the economic and competitive environment.
Proactive management of counterparties whose situation has deteriorated is key to containing the risk of final loss in the event of counterparty failure. As such, the Group has put in place rigorous procedures for monitoring non retail counterparties and/or for closer monitoring of retail counterparties whose risk profiles are deteriorating. In addition, the businesses and entities, in conjunction with the Risk and Finance Departments, and through collaborators specialising in recovery and litigation, work together to effectively protect the Bank’s interests in the event of default.
The future value of exposure to a counterparty as well as its credit quality are uncertain and variable over time, both of which are affected by changes in market parameters. Thus, counterparty credit risk management is based on a combination of several types of indicators:
■indicators of potential future exposures (potential future exposures, or PFE), aimed at measuring exposure to our counterparties:
-the Group controls idiosyncratic counterparty credit risks via a set of CVaR (Counterparty VaR)(2) limits. The CVaR measures the potential future exposure linked to the replacement risk in the event of default by one of the Group’s counterparties. The CVaR is calculated for a 99% confidence level and different time horizons, from one day until the maturity of the portfolio,
(2)The CVaR economic indicator is built on the same modeling assumptions as the regulatory Effective Expected Positive Exposure (EEPE) indicator used to calculate RWAs.
-in addition to the risk of a counterparty default, the CVA (Credit Valuation Adjustment) measures the adjustment of the value of our portfolio of derivatives and repos account the credit quality of our counterparties;
■the abovementioned indicators are supplemented by stress test frameworks or on nominal ones in order to capture risks that are more difficult to measure:
-the more extreme correlation risks are measured via stress tests at different levels (wrong-way risk, stress monitoring at sector level, risk on collateralised financing activities and agency),
-the CVA risk is measured via a stress test in which representative market scenarios are applied, notably involving the credit spreads of our counterparties;
-the amount of collateral posted for each segment of a CCP: the initial posted margins, both for our principal and agency activities, and our contributions to CCP default funds,
-in addition, a stress test measures the impact linked to the default of an average member on all segments of a CCP and the failure of a major member on a segment of a CCP;
■the Global Stress Test on market activities includes cross market-counterparty risks, it is described in more detail in the “Market risk” section.
The Group’s market activities are carried out as part of a business development strategy primarily focused on meeting client requirements through a full range of products and solutions.
Market risk is managed through a set of limits for several indicators (such as stress tests, Value at Risk (VaR) and stressed Value at Risk (SVaR), “Sensitivity” and “Nominal” indicators). These indicators are governed by a series of limits proposed by the business lines and approved by the Risk Division during the course of a discussion-based process.
The choice of limits and their calibration reflect qualitatively and quantitatively the fixing of the Group’s appetite for market risks. A regular review of these frameworks also enables risks to be tightly controlled according to changing market conditions with, for example, a temporary reduction of limits in case of a deterioration. Warning thresholds are also in place to prevent the possible occurrence of overstays.
Limits are set at different sub-levels of the Group, thereby cascading down the Group’s risk appetite from an operational standpoint within its organisation.
Within these limits, the Global Stress Test limits on market activities and the Market Stress Test limits play a pivotal role in determining the Group’s market risk appetite; in fact, these indicators cover all operations and the main market risk factors as well as risks associated with a severe market crisis which helps limit the total amount of risk and takes account of any diversification effects.
The Group is exposed to a diversity of operational risks inherent in its business: execution errors, internal and external fraud, IT system failures, malicious acts against IT systems, loss of operational resources, commercial disputes, failure to comply with tax obligations, but also risk of non-compliance, unappropriated behavior or even reputation.
As a general rule, the Group has no appetite for operational risk or for non-compliance risk. Furthermore, the Group maintains a zero-tolerance policy on incidents severe enough to potentially inflict serious harm to its image, jeopardise its results or the trust displayed by customers and employees, disrupt the continuity of critical operations or call into question its strategic focus.
The Group underscores that it has is no or very low tolerance for operational risk involving the following:
■internal fraud: the Group does not tolerate unauthorised trading by its employees. The Group’s growth is founded on trust, as much between employees as between the Group and its employees. This implies respecting the Group’s principles at every level, such as exercising loyalty and integrity. The Group’s internal control system must be capable of preventing acts of major fraud;
■cybersecurity: The Group has zero tolerance for fraudulent intrusions, in particular those resulting in the theft of customer data or a major operational disruption. The Group intends to introduce effective means to prevent and detect this risk. It is adequately organised to deal with potential incidents;
■data leaks: the Group is committed to deploying the necessary resources and implementing controls to prevent, detect and remediate data leaks. It does not tolerate any leaks of its most sensitive information, in particular that of customer data;
■business continuity: the Group relies heavily on its information systems to perform its operations and is therefore committed to deploying and maintaining the resilience of its information systems to ensure the continuity of its most essential services. The Group has very low tolerance for the risk of downtime in its information systems that perform essential functions, in particular systems directly accessible to customers or those enabling to conduct business on financial markets;
■outsourced services: the Group seeks to achieve a high degree of thoroughness in the control of its activities entrusted to external service providers. As such, the Group adheres to a strict policy of reviewing its providers;
■managerial continuity: the Group intends to ensure the managerial continuity of its organisation to avoid the risk of a long-term absence of a manager that would question the achievement of its strategic objectives, which might threaten team cohesion or disrupt the Group’s relationships with its stakeholders.
The Group measures and strictly controls structural risks. The mechanism whereby rate risk, foreign exchange risk and the risk on pension/long-service obligations is controlled is based on sensitivity or stress limits which are broken down within the various businesses (entities and business lines).
There are four main types of risk: rate level risk, curve risk book, optional risk (arising from automatic options and behavioral options) and basis risk, related to the impact of relative changes in interest rates indices. The Group’s structural interest rate risk management primarily relies on the sensitivity of Net Present Value (“NPV”) of fixed-rate residual positions (excesses or shortfalls) to interest rate changes according to several interest rate scenarios. The limits are established either by the Board of Directors or by the Finance Committee, at the Business Unit/Service Unit and Group levels. Furthermore, the Group measures and controls the sensitivity of its net interest margin (“NIM”) on different horizons.
The Group’s policy in terms of structural exchange rate risks consists of limiting as much as possible the sensitivity of its CET1 capital ratio to changes in exchange rates, so that the impact on the CET1 ratio of an appreciation or a depreciation of all currencies against the euro does not exceed a certain threshold in terms of bp by summing the absolute values of the impact of each currency.
Regarding risks to pension and long-service obligations, which are the Bank’s long-term obligations towards its employees, the amount of the provision is monitored for risk on the basis of a specific stress test and an attributed limit. The risk management policy has two main objectives: reduce risk by moving from defined-benefit plans to defined-contribution plans and optimise asset risk allocation (between hedge assets and performance assets) where allowed by regulatory and tax constraints.
■compliance with regulatory liquidity ratios, with precautionary buffers: LCR (liquiditycoverage ratio) ratios that reflect a stress situation and NSFR (net stable funding ratio);
■maintaining a liability structure to meet the Group’s regulatory constraints (Tier1, Total Capital, Leverage, TLAC, NSFR, MREL) and complying with rating agencies’ constraints to secure a minimum rating level;
■recourse to market financing: annual long-term issuance programs and a stock of moderate structured issues and short-term financing raised by supervised treasuries.
The Group is committed to defining and deploying internal standards to reduce model risk on the basis of key principles, including the creation of three independent lines of defence, the proportionality of due diligence according to each model’s level of risk inherent, the consideration of the models’ entire lifecycle and the appropriateness of the approaches within the Group.
The Group conducts Insurance activities (Life Insurance and Savings, Retirement savings, Property & Casualty Insurance, etc.) which exposes the Group to two major types of risks:
■risks related to financial markets (interest rate, credit and equity) and asset-liability management.
The Group has limited appetite for financial holdings, such as proprietary private equity transactions. The investments allowed are mainly related to:
■commercial support for the network through the private equity activity of the Societe Generale and Crédit du Nord network and certain subsidiaries abroad;
■taking stakes, either directly or through investment funds, in innovative companies via SG Ventures;
Investments made in private equity are managed directly by the networks concerned (Societe Generale, Crédit du Nord and subsidiaries abroad) and are capped at EUR 25 million. Beyond this limit, the investment envelope must be validated by the Group Strategy Department on the basis of a file produced by the Business Unit with the assistance of its Finance Department. This file aims to justify this amount, the expected benefits, the profitability considering the consumption of associated equity, the characteristics of the investments (criteria, types, duration, etc.), a risk analysis and a governance proposal. If the amount exceeds EUR 50 million, it must be validated by the Group’s General Management, with the support of the opinion of the Strategy Department, the Finance Department, the General Secretariat and the Compliance Department. The Business Unit concerned must submit a report on operations and the investment envelope to the Strategy Department every six months.
The other minority holdings are subject to a dedicated validation process in both the investment and divestment phases: validation by the Managers of the Business Units and entities concerned and their Finance Department, the Strategy Department, or even the Group’s General Management (over EUR 50 million) or the Board of Directors (over EUR 250 million). These files are examined by the Strategy Department based on the opinions of the expert Services and Business Units concerned by the operation (at least the Finance Department, the Legal and Tax Departments within the General Secretariat and the Compliance Department). The instruction is based on an analysis of the participation concerned, the motivations and the investment context, the structuring of the operation, its financial and prudential impacts, as well as an assessment of the risks identified and the means implemented to track and manage them.
The settlement-delivery risk on financial instruments arises when transactions (over-the-counter in cash or forward) give rise to a time lag (usually of a few hours) between the payment and the delivery of the underlying (securities, raw materials, foreign exchange, etc.) during their settlement.
-
3.3 RISK APPETITE – GENERAL FRAMEWORK
Risk appetite is determined at Group level and attributed to the businesses and subsidiaries. Monitoring of risk appetite is performed according to the principles described in the Risk Appetite Framework governance and implementation mechanism, which are summarised below.
-approves each year the Group Risk Appetite Statement and the Group Risk Appetite Framework, as well as the Group Risk Appetite Framework,
-approves in particular the main Group risk appetite indicators (Board of Directors indicators) validated beforehand by General Management,
-ensures that risk appetite is relevant to the Group’s strategic and financial objectives and its vision of the risks of the macro-economic and financial environment,
-reviews quarterly the risk appetite dashboards presented to it, and is informed of risk appetite overruns and remediation action plans,
-sets the compensation of corporate officers, sets out the principles of the remuneration policy applicable in the Group, especially for regulated persons whose activities may have a significant impact on the Group’s risk profile, and ensures that they are in line with risk management objectives.
-approves the Risk Appetite Statement and its Risk Appetite Framework based on the proposal of the Chief Risk Officer and the Chief Financial Officer,
-ensures that the risk appetite for the Group’s Business Units and eligible subsidiaries/branches is formalised and translated into frameworks consistent with the Group’s risk appetite,
-ensures internal communication of risk appetite and its transposition in the Universal Registration Document.
In addition, the main mission of the Risk Department is to develop the Group’s risk appetite, as well as the implementation of a risk management, monitoring and control system.
The Finance Department contributes to setting this risk appetite in the framework of indicators under the responsibility of the Finance Committee (profitability, solvency, liquidity and structural risks).
The Compliance Department is also responsible for instructing the risk appetite setting for indicators falling within its scope.
The risk identification process is a cornerstone of the Group risk-management framework. It is a Group-wide process to identify all risks that are or might be material. The approach is comprehensive and holistic: it covers all risk types(1) and all Group exposures.
In addition to the annual review of the Group’s risk taxonomy, risk identification process is based on two pillars in order to ensure a complete and up-to-date view of all the material risks facing the Group:
■risk management governance and key Committees such as CORISQs or COFI at Group or Business Unit level or New Product Committees making it possible to monitor changes in the risk profile for all types of risk (credit, market, operational, etc.). In addition to monitoring well-identified risks, this governance can also generate a debate between risk experts and senior management on emerging risks. This debate is fueled by the latest market news, early warning signals, internal alerts, and more;
■a series of exercises aimed at identifying additional risks, for example arising from changes in macroeconomic or sectoral conditions, financial markets, regulatory constraints, competitors or market pressure, business model (concentration effects) and changes in banking organisations. These additional identification exercises are also organised by risk types, but include some identification of cross-risk effects (e.g. credit and market or credit and operational). For a given type of risk, these exercises analyse and segment the Group’s exposure along several axes (Business Unit, activity, customer, product, region, etc.). The underlying risk factors are identified for the perimeters where this risk is assessed as being significant.
When a significant risk is identified, a risk management system, which may include a quantitative risk appetite (risk ceiling or threshold) or a risk policy, is implemented.
In addition, where possible, the risk factors underlying a significant risk are identified and combined in a dedicated scenario, and the associated loss is then quantified by means of a stress test (see also section “Risk quantification and stress test system”).
For each identified material risk, indicators to measure this risk are introduced to ensure monitoring. These indicators can be based on measurements of outstandings (risk weighted or not), sensitivities to the variation of one or more risk factors (interest rate, etc.), impacts of stress tests based on scenarios, etc. These indicators can be expressed as ratios and are sometimes the subject of regulatory or publication requirements.
(1)Risks are classified on the basis of the Group’s risk taxonomy, which names and defines risk categories and their possible sub-categories.
Regarding more specifically stress tests, or crisis simulations, they assess what would be the behavior of a portfolio, activity, entity or Group in a context of degraded activity.
Within the Group, stress tests contribute to the identification, measurement and management of risks, as well as to the assessment of the adequacy of capital and liquidity to the Group’s risk profile.
■are a preferential measure providing information on the resilience of the Group, its activities and its portfolios, and are an integral part of the process of building risk appetite;
■are based on hypothetical economic scenarios defined in conjunction with the Economic and Sectoral Studies Department, or historical scenarios. The stress tests break down these scenarios into impacts on the Group’s activities, by taking into account the reaction capacities of the activities, by systematically combining quantitative methods and expert judgment (risks, finance or business lines);
■a global stress test, integrated into the budget process (Strategic and financial plan), to ensure that the Group’s profile meets its objectives in the event of an adverse scenario, but also to quantify the deterioration in the profitability of the Business Units in this scenario. The stress test system is an integral part of the ICAAP (Internal Capital Adequacy Assessment Process);
-stress tests on credit risk complete the overall analysis with a more granular approach, and thus shed light on the fixing of risk appetite at a portfolio, activity, etc. They are also used to refine the identification, measurement and operational management of this risk,
-stress tests on market activities are based on historical and hypothetical scenarios and apply to the entire Group. They are supplemented by specific sensitivity stress tests on certain risk factors (rates, equities, etc.) or certain activities (emerging markets, etc.). A stress test limit is established for these different risk measures,
-stress tests assess the sensitivity of structural interest rate risk. The exercise focuses on changes in the economic value of assets and liabilities in bank portfolios and on changes in the net interest margin generated by these assets and liabilities. The Group sets limits on these sensitivities in scenarios of translation and deformation (steepening and flattening) of the yield curves,
-a stress test on social commitments consists of simulating the impact of variations in market risk factors (inflation, interest rate, etc.) on the Group’s net position (dedicated investments minus the corresponding social commitments). A stress test limit is established on this indicator,
-an assessment of operational risk under stress uses the scenario analysis and loss modeling work to calibrate the Group’s capital requirement regarding operational risk, and makes it possible to understand the exposure to operational losses, including exposure to rare and severe losses not present in the history,
-stress tests of insurance activities support the process of defining the risk appetite of the Insurance Business Unit, which is based on minimum profitability and solvency targets for a central and a stressed scenario. The Insurance Business Unit also uses also results from stress tests to define its hedging policy, the distribution of its assets and the dividend distribution policy;
■reverse stress tests, both as part of the risk appetite and the recovery plan. The impact of these stress tests is typically defined by a breaking point in the solvency ratio or liquidity indicator, which poses a significant threat to the Bank. Hypothetical scenarios leading to this breaking point are then constructed in order to identify new weaknesses.
In addition to internal stress test exercises, the Group is part of the sample of European banks participating in major international stress test programs piloted by the EBA (European Banking Authority) and the ECB (European Central Bank).
More specifically on climate risk, the Group participated on a voluntary basis in exploratory climate stress exercises organised by the ACPR (Autorité de contrôle prudentiel et de résolution) and the European Banking Authority in 2020. A stress test coordinated by the ECB in which the Group is participating is also being performed in the first half of 2022.
DEFINITION OF THE “CENTRAL” AND “STRESSED” ECONOMIC SCENARIOS
The central scenario is based first of all on a set of observed factors such as recent economic situation and economic policy shifts (budgetary, monetary and exchange-rate policies). From these observed factors, economists calculate the most likely trajectory of economic and financial variables for the desired forecast horizon.
The severity of the stressed scenario, which is determined by the deviation of the GDP trajectory from the central scenario, is based on the magnitude of the 2008-2009 crisis and has been adjusted to take into account the impacts - health, economic and financial - of the Covid-19 crisis on the basis of current knowledge. The severity is constantly compared to that of various adverse scenarios produced by reputable institutions such as the ECB, the Bank of England or the Federal Reserve.
■the frameworks relating to the management of the Group’s main risks (qualitative, through risk policies, and quantitative, through indicators).
Regarding the profile of profitability and financial soundness, the Finance Department proposes each year, upstream of the budgetary procedure, to the General Management, financial targets at Group level. These targets, supplemented by alert thresholds and crisis levels according to a “traffic light” approach, allow:
■to respect, with a sufficient safety margin, the regulatory obligations to which the Group is subject (in particular the minimum regulatory solvency, leverage and liquidity ratios), by anticipating as best as possible the implementation of new regulations;
■to ensure, via a safety margin, sufficient resistance to stress scenarios (stress standardised by regulators or stress defined according to a process internal to the Group).
The frameworks relating to risk management, also represented via a graduated approach (limits, alert thresholds, etc.), result from a process in which the needs expressed by the businesses are confronted with a contradictory opinion independent from the second line defence. The latter is based on:
For the main risks, the frameworks set make it possible to consolidate the achievement of the Group’s financial targets and to orient the Group’s profitability profile.
The allocation of risk appetite in the organisation is based on the strategic and financial plan, and on risk management systems:
■based on recommendations by the Finance Department to General Management, the financial targets defined at Group level are broken down into budget allocation targets at business level as part of the budget and the strategic and financial plan;
-
3.4 RISK MANAGEMENT ORGANISATION
Implementing a high-performance and efficient risk management structure is a critical undertaking for Societe Generale Group in all businesses, markets and regions in which it operates, as is maintaining a balance between strong awareness of risks and promoting innovation. The Group’s risk management, supervised at the highest level, is compliant with the regulations in force, in particular the order of 3 November 2014 revised by the order of 25 February 2021 on the internal control of companies in the banking sector, payment services and investment services subject to the control of the French Prudential Supervisory and Resolution Authority (Autorité de contrôle prudentiel et de résolution – ACPR) and European Regulations Basel 3 (CRR/CRD). (See Board’s Expertise, p. 82 of the 2022 Universal Registration Document).
Two main high-level bodies govern Group risk management: the Board of Directors and General Management.
General Management presents the main aspects of, and notable changes to, the Group’s risk management strategy to the Board of Directors at least once a year (more often if circumstances so require).
As part of the Board of Directors, the Risk Committee (see Art. 11 of the Internal rules of the Board of Directors, p. 85 of the 2022 Universal Registration Document) advises the Board on overall strategy and appetite regarding all kinds of risks, both current and future, and assists the Board when the latter verifies that the strategy is being rolled out.
The Board of Directors’ Audit and Internal Control Committee (see Art. 10 of the Internal Rules of the Board of Directors, p. 84) ensures that the risk control systems operate effectively.
Chaired by General Management, the specialised Committees responsible for central oversight of internal control and risk management are as follows:
■the Risk Committee (CORISQ), which met twenty-one times during the 2021 financial year, aims to define the Group’s main orientations in terms of risks (credit and counterparty risks, environmental risks, country, market risk, operational risk, model risk, etc.) within the framework of the risk appetite and the financial targets set by the Board, and to monitor compliance in such respect. Subject to the powers attributed to the Board of Directors, the CORISQ chaired by the Chief Executive Officer, based on proposals from the Risk Division, validates the main decisions relating to the management of these various risks. Along with the Risks Committee, the Major Risks Committee (Comité Grands Risques) is an ad hoc body that validates the commercial strategy and risk-taking with regard to large client groups;
■the Finance Committee (COFI), chaired by the Chief Executive Officer, is responsible for setting out the Group’s financial strategy and for managing scarce resources (capital, liquidity, balance sheet, tax capacity). The COFI, based upon proposals from the Finance Division and the Risk Division, validates The Corporate Divisions provide the Group’s General Management with all the information needed to perform its role of managing Group strategy under the authority of the Chief Executive Officer. The Corporate Divisions report directly to General Management;
■the Compliance Committee (COMCO), chaired by the Chief Executive Officer, defines the Group’s main guidelines and principles in terms of compliance and monitors, on an annual basis, the quality of the CSR risk management framework (including compliance with the French Duty Care law (’Devoir de Vigilance’) and the Modern Slavery Act UK);
■the Digital Transformation Committee (DTCO), chaired by the Chief Executive Officer, in line with the Group Strategy Committee’s decisions, initiates and monitors changes in the information system and the relevant operational model which require approval by General Management due to their cross-business character or to the scale of the envisaged transformation;
■the Group Internal Control Coordination Committee (GICCC), chaired by the Chief Executive Officer or, in his absence, by a Deputy Chief Executive Officer, aims to perform the regular review of the internal control framework and of non financial risks of each second line of defense, to assess it in terms of efficiency, consistency and completeness, to take corrective actions and to monitor their implementation;
■the Supervisory Internal control coordination committee (SICCC), chaired by the Chief Executive Officer or, if absent, a Deputy Chief Executive Officer or a Deputy General Manager in charge of the area under review, aims to perform the regular review of the internal control framework and of non financial risks of each Business Units/Service Units of the first line of defence, to assess it in terms of efficiency, consistency and completeness, to take corrective actions and to monitor their implementation;
■the Non Financial Risks Steering Committee, chaired by the Deputy Chief Executive Officer in charge of Risk and Internal Control supervision of the Group, aims to implement and instruct the orientations taken in the Group Internal Control Coordination Committee (GICCC) and those resulting from the CACI, to ensure the consistency, efficiency and effectiveness of the transformation of non financial risks (NFR) frameworks, to set targets in relation to the roadmaps, to validate, coordinate and steer the evolution of NFR frameworks throughout the Group, to identify risks and alerts related to NFR frameworks, to provide resources, to prioritise and decide on their allocation and to arbitrate if necessary;
■the Responsible Commitments Committee (CORESP), chaired by the Chief Executive Officer, deals with topics related to the Group’s commitments and normative framework in CSR (including CSR sectoral policies), culture and conduct, or other topics that have an impact on the Group’s liability and are not already covered by an existing committee;
■the Group Provisions Committee (COPRO), chaired by the Chief Executive Officer, meets quarterly and aims to review the Group’s provisions for the quarter in question.
The Group’s Corporate Divisions, which are independent from the core businesses, contribute to the management and internal control of risks.
The Corporate Divisions provide the Group’s General Management with all the information needed to perform its role of managing Group strategy under the authority of the Chief Executive Officer. The Corporate Divisions report directly to General Management.
■the Risk Division aims to contribute to the development of the Group’s activities and sustainable profitabilityby developing, with the Finance Department and the Business Units/Service Units, the Group’s risk appetite (declined in the Group’s various businesses) as well as the implementation of a control and monitoring system risks as part of its role as a second line of defence. The Risk Division is under the supervision of the Group Chief Executive Officer.
When performing its work, the Risk Division reconciles independence from the businesses with a close working relationship with the Business Units, which are ultimately responsible for the risks associated with the transactions they initiate.
-examines, with the Finance Division, the setting of the Group’s risk appetite through the Group’s Risk Appetite Statement which is proposed to General Management and ultimately approved by the Board of Directors,
-implements a governance and monitoring system for these risks, including cross-business risks, and regularly reports on their nature and extent to General Management, the Board of Directors and the banking supervisory authorities,
-helps define the risk policies, taking into account the objectives of the businesses and the relevant risk issues,
-defines or validates the methods and procedures used to analyse, measure, approve and monitor risks,
-implements a second-level control to ensure the correct application of these methods and procedures,
-defines or validates the architecture of the central risk information system, ensures its suitability to business requirements;
■the Finance Division is organised according to three levels of supervision, each reporting to a Deputy Chief Financial Officer:
-cross-business functions, bringing together all the areas of expertise that are key to the Finance Division;
-the Group Accounting Department is responsible for coordinating the mechanism used to draw up the Group’s consolidated financial statements,
-the Experts on Metrics and Reporting Department is responsible for producing the regulatory reports of the Group,
-the Mutualised Transactions Processing Department manages the shared service centers of the Finance Division with the support of its Paris teams and the oversight of Finance teams in Bucharest and Bangalore,
-the Finance Control Department is responsible for the second-level permanent control system across all the Finance processes,
-the Asset and Liability Management Department is in charge of the ALM function for the Group, of controlling the Group’s liquidity and exchange rate risks, as well as the operational management of ALM for the Societe Generale Parent Company (SGPM);
The other cross-business functions perform various tasks for the Finance Division, in particular with the Finance Division of the Group Service Units, Group Investor Relations and Financial Communication, Human Resources and the Corporate Secretary.
■the Finance Departments of the Business Units and Service Units, which report hierarchically to the Group Finance Division, ensure that the financial statements are prepared correctly at local level and control the quality of the information in the Financial Reports (accounting, management control, regulations, etc.);
■the Group Compliance Division is responsible for the definition and consistency of the non-compliance risk prevention and control framework, related to banking and financial regulation and for coordinating the framework aimed at preventing, identifying, assessing and controlling non-compliance risk across the entire Group. It ensures that roles and responsibilities are identified with the appropriate level of expertise so that the regulatory watch framework and related normative documentation, including its deployment, are operational. In particular, it takes care to harmonise procedures and optimise (in conjunction with the BU/SUs) international resources in order to ensure the framework’s effectiveness and compliance with its rules. Within this framework, it has hierarchical and functional authority over the compliance teams of Group entities;
The Group Compliance Service Unit is organised around three broad categories of non-compliance risks :
-financial security: know your customer (KYC); compliance with the rules and regulations on international sanctions and embargoes; countering money laundering and terrorist financing (AML/CTF), including reporting suspicious transactions to the appropriate financial intelligence authority when necessary,
-regulatory risks: customers protection; integrity of the financial markets; countering bribery and corruption, ethics and good conduct; compliance with regulations related to tax transparency (based on knowledge of clients’ tax profile); compliance with regulations on social and environmental responsibility and the Group’s commitments,
-the Group Legal Department, which ensures in particular the security and legal regularity of the Group’s activities, drawing on the legal services of subsidiaries and branches where applicable,
-the Group Security Department, which oversees the Group’s security in conjunction with the Service Unit of the Resources and Digital Transformation Department regarding the security of information systems,
-the Group’s Administrative Department, which provides the Group’s central administration services and provides support, as necessary, to the Secretary of the Board of Directors;
■the Human Resources and Communication Department monitors the implementation of compensation policies, amongst other things;
■the Corporate Resources and Innovation Department is specifically responsible for defining the policies to be applied in matters of information systems and information systems security policies;
■the Group Internal Audit and General Inspection Department is in charge of internal audits and reports to the Head of Group Internal Audit.
Finally, the Sustainable Development Department reporting to General Management assists the Deputy Chief Executive Officer in charge of all ESG (CSR) policies and their effective translation into the trajectories of businesses and functions. It supports the Group’s CSR transformation to make it a major competitive advantage both in business development and in E&S risk management. the Sustainable Development Department provides advice to the General Management through three main tasks:
According to the last census carried out (on 31 December 2021), the full-time equivalent (FTE) workforce of :
■the Group’s Risk Department for the second line of defence represents approximately 4,609 FTEs (1,550 within the Group’s Risk Department itself and 3,059 for the rest of the Risk function);
The Group’s risk measurement systems serve as the basis for the production of internal management reports allowing the monitoring of the Group’s main risks (credit risk, counterparty, market, operational, liquidity, structural, settlement/delivery) as well as the monitoring of compliance with the regulatory requirements.
The risk reporting system is an integral part of the Group’s risk management system and is adapted to its organisational structure. The various indicators are thus calculated at the level of the relevant legal entities and Business Units and serve as the basis for the various reportings. Departments established within the Risk, Finance and Compliance sectors are responsible for measuring, analysing and communicating these elements.
Since 2015, the Group has defined architecture principles common to the Finance and Risk functions, the TOM-FIR principles (Target Operating Model for Finance & Risk), in order to guarantee the consistency of the data and indicators used for internal management and regulatory production. The principles revolve around:
■Risk and Finance uses, whether at the local level and at the various levels of consolidation subject to an organised system of “golden sources”, with a collection cycle adapted to the uses;
■consistency of Finance and Risk usage data, via strict alignment between accounting data and management data.
The Group produces, via all of its internal reports for internal monitoring purposes by the Business Units and Service Units, a large number of risk metrics constituting a measure of the risks monitored. Some of these metrics are also produced as part of the transmission of regulatory reports or as part of the publication of information to the market.
The Group selects from these metrics a set of major metrics, able to provide a summary of the Group’s risk profile and its evolution at regular intervals. These metrics concern both the Group’s financial rating, its solvency, its profitability and the main risks (credit, market, operational, liquidity and financing, structural, model) and are included in the reports intended for internal management bodies.
They are also subject to a framework defined and broken down in line with the Group’s risk appetite, giving rise to a procedure for reporting information in the event of breaches.
Thus, the risk reports intended for the management bodies are guided in particular by the following principles:
■combination of a global and holistic view of risks and a more in-depth analysis of the different types of risk;
■overview supplemented by focus on certain specific scopes, forward-looking elements (based in particular on the presentation of elements on the evolution of the macro-economic context) and elements on emerging risks;
■monthly reporting to the Risk Committee of the Board of Directors aims to provide an overview of changes in the risk profile.
A dashboard for monitoring the Group’s Risk Appetite Statement indicators is also sent quarterly to the Board of Directors. These indicators are framed and presented using a “traffic light” approach (with distinction between thresholds and limits) in order to visually present monitoring of compliance with risk appetite. In addition, a compliance dashboard and a reputation dashboard are sent to the Risk Committee of the Board of Directors and provide an overview of each non-compliance risk.
■monthly reporting to the Group Risk Committee (CORISQ) aims to regularly provide this committee with a risk analysis under its supervision, with a greater level of detail than reporting to the Risk Committee of the Board of Directors. In particular, a summary of the main credit files over the period covered by the reporting is presented;
■reporting to the Finance Committee (COFI) for General Management gives rise in particular to the following two reports: a “Scarce resources trajectory” report allowing budget execution to be monitored and a “Structural risk monitoring (ALM)” report » making it possible to monitor compliance with the thresholds and limits relating to liquidity risks and structural interest and exchange rate risks;
■the quarterly reporting of the Group Compliance Committee (COMCO) to General Management: the COMCO provides via dedicated reporting an overview of the main non-compliance risks, raises points of attention on compliance topics Group, decides on the main orientations and defines the Group principles in terms of compliance;
■the quarterly reporting of the Provisions Committee (COPRO) to General Management is intended to provide an overview of changes in the level of provisions at Group level. In particular, it presents the change in the net charge of the cost of risk by pillar, by Business Unit and by stage;
■reporting by the Group Internal Control Coordination Committee (GICCC) to General Management: this committee reviews, on the basis of a standardised dashboard for all Business Units/Service Units, the efficiency and the consistency of the permanent control system implemented within the Group, as well as, within the framework of the Risk Internal Governance Assessment (RIGA) process, the ability of the Risk function to exercise its role as the 2nd line of defence in the whole group. Finally, the Risk Department contributes, as a permanent member, to all GICCC meetings, through position papers on the subjects under review.
Although the above reports are used at Group level to monitor and review the Group’s risk profile in a global manner, other reports are transmitted to the Board of Directors or to the General Management in order to monitor and control certain types specific risks.
Ad hoc reports can also be produced. By way of illustration, the Group had to adapt its risk management system from the start of the Covid-19 crisis in March 2020. Governance was also strengthened during this period thanks to the activation of cells crisis and the implementation of dedicated reports, whether intended for General Management, the Board of Directors or the supervisor, produced at a higher frequency and including indicators adapted to the context (monitoring of sectors of activity sensitive/weakened by the economic crisis, business continuity, etc.). This crisis mechanism was gradually eased in 2021.
Additional information on risk reporting and assessment systems by type of risk is also presented in the following chapters.
INTEREST RATE BENCHMARK REFORM
The interest rate benchmark reform (IBOR: InterBank Offered Rates), initiated by the Financial Stability Board in 2014, aims at replacing these benchmark rates with alternative rates, in particular the Risk-Free Rates (RFR). This reform accelerated on 5 March 2021, when the Financial Conduct Authority, the supervisor of LIBOR, announced the official dates for the cessation of loss of representativeness:
■EUR and CHF LIBOR (all terms); GBP and JPY LIBOR (terms: overnight, one week, two months and twelve months); LIBOR USD (terms: one week and two months): the publication of these benchmark settings contributed by a panel of banks has permanently ceased as of 1 January 2022;
■LIBOR GBP and JPY (terms: one, three and six months): these settings have not been contributed by a panel of banks since 1 January 2022 and are, from now on, published in a synthetic form; thus, their use is restricted to the wind-down of legacy positions;
■LIBOR USD (terms: overnight, one, three, six and twelve months): the cessation of the publication of these benchmark settings contributed by a panel of banks is scheduled for end June 2023.
Besides, regarding the major euro area interest rate benchmark indexes:
■EURIBOR: EMMI (European Money Markets Institute), administrator of the index, does not plan to cease its publication. The EURIBOR will thus be maintained in the coming years;
■EONIA: Its publication ceased definitively on 3 January 2022. The successor rate recommended by the European Central Bank working group on the euro area is the €STR on which the EONIA was based since end 2019.
In parallel, other interest rate indexes based on LIBOR are also subject to reform (e.g.: SOR, MIFOR, THBFIX, ICE swap rate…). Local regulators or administrators continue clarifying the roadmap and issuing recommendations to reduce the risks associated with these transitions.
Impact of the reform for the Societe Generale Group
The Societe Generale Group supports these reforms and takes an active part in the working groups set up by the central banks of the currencies concerned. The Group is actively preparing for these changes, through specific transition program put in place in Summer 2018 and supervised by the Finance division.
For this purpose, the Group has undertaken active awareness and communication campaigns for its customers, supplemented by a monthly newsletter and a question and answer kit on the IBOR transition publicly available on the Societe Generale website.
With the cessation deadlines announced for LIBOR and EONIA in mind, the public authorities and the working groups set up by the central banks issued recommendations to the industry. These recommendations aim at stopping the production of new contracts referencing these indexes as well as at migrating the existing contracts referencing said indexes to alternative benchmark rates.
To ensure a consistent approach throughout the Societe Generale group, an internal Committee has been formed. Its role is to issue periodical orientations reflecting the market trends and recommendations from regulators and their working groups. At the time of writing of this note, ten internal guidelines have been issued and cover three main themes:
■strengthening of the new contracts through the inclusion of fallback clauses and risk warnings;
■cessation of the production of new transactions referencing LIBOR and EONIA (with some exceptions provided for by regulators on USD LIBOR) and use of alternative solutions;
■fair and homogenous treatment of customers through the involvement of the compliance teams in the renegotiations of contracts.
At this stage, all directives are applied and widely circulated among the Group staff.
In order to acquire the capacity to deal on products referencing RFRs and thus ensure the continuity of its business after the disappearance of LIBOR and EONIA, the Societe Generale group updated its tools and processes in line with the major calculation methods recommended by the relevant working groups or professional associations. Nevertheless, the Group continues monitoring the developments in the use of RFRs and other alternative rates in order to implement any new conventions and meet its customers’ needs.
The progressive cessation of the production of new products indexed on LIBOR and EONIA started in Spring 2021 and the Societe Generale group has been offering to guide its customers towards alternative solutions since then. In parallel, the Group has introduced fallback clauses in line with the market standards in the new contracts that remain indexed on the IBOR indexes (EURIBOR included).
In 2021, the Group focused its action on transitioning its agreements referencing GBP LIBOR, CHF LIBOR, JPY LIBOR, and EUR LIBOR, as well as EONIA. This transition concerned in the first instance the customers of the investment banking and financing and advisory activities and, to a lesser extent, some customers of the French and International retail networks. Depending on the products, the transition has, overall, been carried out according to three major modalities:
■loans and credit lines are subject to individual renegotiations, together with the related hedging instruments, in order to maintain their effectiveness;
■most of the derivative products have been transitioned at the instigation of the clearing houses or through the activation of their fallback clauses (protocol set up by the ISDA and to which the Societe Generale group acceded in October 2020). Some derivative products have, however, been renegotiated bilaterally;
■lastly, for some products (typically: cash accounts and similar), the transition has been done through an update of the general conditions.
In parallel, the Societe Generale group ensured that transitional solutions were provided regarding the few issuances having an early call option dependant on LIBOR in the event that these options were not exercised, The only issuance directly indexed to JPY LIBOR rate (ISIN JP525016CF64) has been switched to TONA RFR in December 2021 via a consent solicitation.
At the end of December 2021, the Societe Generale group considers that it has achieved more than 99.5% of its legal transition programme regarding the contracts on indexes ending or ceasing to be representative at the end of 2021. The remainder corresponds mainly to contracts being renegotiated at that date and for which the use of synthetic LIBORs will allow for the transition at the beginning of 2022.
Regarding the contracts referencing the major terms of USD LIBOR, and due to their disappearance scheduled for end of June 2023, the Societe Generale group has not yet launched a massive transition of its current stock but aims at completing it in June 2023. However, the Group offers a proactive switch to alternative solutions whenever it interacts with customers and supports customers wishing to opt in early in their transition process.
The table below presents an estimate of the exposures related to the contracts impacted by the benchmark reform and whose term is scheduled beyond the official cessation dates.
This table has been produced based on the project monitoring data and on the legal status of the contracts migration. At the end of January 2022, there were no significant exposures on the indexes ceasing to be representative as at 31 December 2021.
(In EURbn)
2021
Current interest rate benchmarks(5)
New risk-free rates liable
to replace the current interest
rate benchmarks
Outstanding principal
Notional(1)
Financial
assets(2) (excl.
derivatives)
impacted by
the reform
Financial
liabilities(3)
(excl.
derivatives)
impacted by
the reform
Derivatives(4)
impacted by
the reform
Indices whose listing ends on 31/12/2021 – Exposures as at 31 January 2022
1
0
0
EONIA - Euro OverNight Index Average
Euro Short-Term Rate (€STR)
0
0
0
LIBOR - London Interbank Offered Rate – GBP
Reformed Sterling Overnight Index Average (SONIA)
1
0
0
LIBOR - London Interbank Offered Rate - CHF
Swiss Average Rate Overnight (SARON)
0
0
0
LIBOR - London Interbank Offered Rate – JPY
Tokyo OverNight Average (TONA)
0
0
0
LIBOR - London Interbank Offered Rate – EUR
Euro Short-Term Rate (€STR)
0
0
0
Indices whose listing ends on 30/06/2023 – Exposures as at 30 November 2021
35
3
2,403
LIBOR - London Interbank Offered Rate - USD
Secured Overnight Financing Rate (SOFR)
35
3
2,397
SOR - Singapore Dollar Swap Offer Rate
Singapore Overnight Rate Average (SORA)
0
0
6
(1)Notional used in combination with an interest rate benchmark in order to calculate derivative cash flows.
(2)Including accounts receivable, loans, securities received under repurchase agreements, debt securities bearing interest at variable rates.
(3)Including deposits, borrowings, transactions on securities delivered under repurchase agreements, debt issued in the form of securities bearing interest at variable rates.
(4)Including firm instruments (swaps and futures) and conditional instruments.
(5)Only the major interest rate benchmarks impacted by the IBOR reform are presented in this table. The EURIBOR construction methodology was reformed in 2019 and revised in 2020. Its cessation was announced neither by EMMI – its administrator - nor by ESMA – its regulator. Contracts exposed to this rate are therefore no longer presented in this table.
RISKS ASSOCIATED WITH RATE REFORM
The risks related to the IBOR reform are now mainly limited to USD LIBOR for the period running until June 2023. They remain managed and monitored within the governance framework dedicated to the IBOR transition. They have been identified as follows:
■program governance and execution risk, liable to cause delays and loss of opportunities, is monitored as part of the work of regular Committees and arbitration bodies;
■legal documentation risk, liable to lead to post-transition litigations, is managed through fallback clauses inserted in the contracts depending on the availability of market standards;
■market risk, with the creation of a basis risk between the rate curves associated with the different indexes, is the subject of close monitoring and supervision;
■operational risks in the execution of the transition of transactions, depending in particular on the willingness and preparedness of our counterparties, the volume of transactions to be migrated and their spread over time;
■liquidity risk related to increased drawdowns in a context of increased credit costs; the relevance of the integration of this component into the liquidity models will be assessed during the annual review of the drawdown models;
■regulatory risk managed according to the Group guidelines which are in line with the recommendations of the regulators and working groups on the LIBOR transition; these guidelines concern the products which, by exception, continue referencing USD LIBOR;
■misconduct risk, related to the end of LIBOR, notably managed through:
-specific guidelines detailed by business line,
-training of the teams,
-communications to customers (conferences, events, bilateral discussions in particular with the less informed customers) are organized on the transition-related risks, the alternative solutions that may be implemented, and on how they could be affected.
-
4.1 INTERNAL CONTROL
In France, the conditions for conducting internal controls in banking institutions are defined in the Order of 3 November 2014 modified by the Order of 25 February 2021. This Order, which applies to all credit institutions and investment companies, defines the concept of internal control, together with a number of specific requirements relating to the assessment and management of the various risks inherent in the activities of the companies in question, and the procedures under which the supervisory body must assess and evaluate how the internal control is carried out.
The Basel Committee has defined four principles – independence, universality, impartiality, and sufficient resources – which underpin the internal control carried out by credit institutions.
The Board of Directors ensures that Societe Generale has a solid governance system and a clear organization ensuring:
■effective procedures for the detection, management, monitoring and reporting of risks to which the Company could be exposed.
The Board tasks the Group’s General Management with rolling out the Group’s strategic guidelines to implement this set-up.
The Audit and Internal Control Committee is a Board of Directors’ Committee that is specifically responsible for preparing the decisions of the Board in respect of internal control supervision.
As such, General Management submits reports to the Audit and Internal Control Committee on the internal control of the Group. The Committee monitors the implementation of remediation plans when it considers the risk level to be justified.
All Societe Generale Group activities are governed by rules and procedures contained in a set of documents referred to collectively as the “Standard Guidelines”, compiled in the Societe Generale Code, which:
■define the governance of the Societe Generale Group, the structures and duties of its Business Units and Services Units, as well as the operating principles of the cross-business systems and processes (Codes of Conduct, charters, etc.);
■set out the operating framework of an activity and the management principles and rules applicable to products and services rendered, and also define internal procedures.
The Societe Generale Code has force of law within the Group and falls under the responsibility of the Group Corporate Secretary.
In addition to the Societe Generale Code, operating procedures specific to each Group activity are applied. The rules and procedures in force are designed to follow basic rules of internal control, such as:
Multiple and evolving by nature, risks are present in all business processes. Risk management and control systems are therefore key to the Bank’s ability to meet its targets.
The internal control system is represented by all methods which ensure that the operations carried out and the organization and procedures implemented comply with:
■the internal rules and guidelines defined by the Company’s management body of the undertaking in its executive function.
■ensure the adequacy and effectiveness of internal processes, particularly those which help safeguard assets;
■the comprehensive scope of the controls, which cover all risk types and apply to all the Group’s entities;
■the individual responsibility of each employee and each manager in managing the risks they take or supervise, and in overseeing the operations they handle or for which they are responsible;
■the responsibility of functions, in line with their expertise and independence, in defining normative controls and, for three of them, exercising second-level permanent control;
The internal control framework is based on the “three lines of defense” model, in accordance with the Basel Committee and European Banking Authority guidelines:
■the first line of defense comprises all Group employees and operational management, both within the Business Units and the Services Units in respect of their own operations.
Operational management is responsible for risks, their prevention and their management (by putting in place first-level permanent control measures, amongst other things) and for implementing corrective or remedial actions in response to any deficiencies identified by controls and/or process steering;
■the second line of defense is provided by the risk and compliance functions, as well as by the finance function for the year 2021 (from the financial year 2022, the finance function will fall under the first line of defense).
Within the internal control framework, operational management is responsible for verifying the proper and continuous running of the risk security and management operation functions through the effective application of established standards, defined procedures, methods and requested controls.
Accordingly, these functions must provide the necessary expertise to define in their respective fields the controls and other means of risk management to be implemented by the first line of defense, and to ensure that they are effectively implemented; they conduct second-level permanent control over all of the Group’s risks, based in particular on the controls they have defined, as well as those defined, if necessary, by other expert functions (e.g. sourcing, legal, tax, human resources, information system security, etc.) and by the businesses;
■the third line of defense is provided by the Internal Audit Division, which encompasses the General Inspection and Internal Audit functions. This division performs periodic internal audits that are strictly independent of the business lines and the permanent control function;
■internal control coordination, which falls under the responsibility of a Deputy Chief Executive Officer for the year 2021 and the Chief Executive Officer from 2022, is also provided at Group level and is rolled out in each of the divisions and core businesses.
A Deputy Chief Executive Officer for 2021 and the Chief Executive Officer from 2022 is responsible for ensuring the overall consistency and effectiveness of the internal control system.
The Internal Control Coordination Committee is responsible for providing a consolidated overview of the Group’s internal control framework, assessing its effectiveness, completeness and consistency, taking corrective measures, and monitoring their implementation.
It is chaired by the Deputy Chief Executive Officer for 2021 and the Chief Executive Officer from 2022 and comprises the Chief Risk Officer, the Chief Financial Officer, the Group Chief Compliance Officer, the Group Chief Information Officer, the Head of Group Internal Audit, and the Head of Internal Control Coordination.
The Group Internal Control Coordination Committee met nine times in 2021. It addressed the following issues:
■review of the effectiveness of the permanent control in the Risk, Compliance and Finance Service Units, as well as the ability of the Risk and Compliance functions to exercise their role as the Second Line of Defense for the Group;
■review of the Group quarterly permanent control dashboard prior to its communication to the Group Audit and Internal Control Committee (CACI);
The Supervisory Internal Control Coordination Committee (SICCC) performs the regular review of the internal control framework and of risks of every second BU/SU, assessing it in terms of efficiency, consistency and completeness, taking corrective actions and monitoring their implementation.
It is chaired by the representative of General Management (Chief Executive Officer Deputy Chief Executive Officer or Deputy General Manager) in charge of the area under review and brings together the Heads of the second line of defense (CPLE, DFIN, RISQ), the Head of the Group’s Information Systems (RESG), the Head of the third line of Defense (IGAD), the Head of the Permanent Control Framework and the Coordination of Internal Control (DGLE/PIC), as well as the Heads Business Units and Service Units concerned with the agenda and transversal functions according to the agenda.
The organization implemented at Group level to coordinate the actions of the various participants in internal control is coordinated in each Business Unit (BU) and Service Unit (SU). All of the Group’s BUs and SUs have an Internal Control Coordination Committee. Chaired by the Head of the Business Unit or the Service Unit, these Committees bring together the competent Heads of Internal Audit and Permanent Control for the Business Unit and Service Unit in question, as well as the Head of Group Internal Control Coordination and the Heads of the Group-level control functions.
■the first-level permanent control, which is the basis of the Group’s permanent control, is performed by the businesses. Its purpose is to ensure the security, quality, regularity and validity of transactions completed at operational level;
■the second-level permanent control, which is independent of the businesses and concerns three divisions, i.e. the Compliance, Risk and Finance Divisions.
In 2018, General Management initiated a transformation program of the Group’s permanent control system, which is under its direct supervision. Through a set of actions focusing on areas such as standards, methods, tools, procedures and training, the program served to consolidate the control culture and optimize risk control, and thus helps to improve the quality and the reliability of services provided to our customers and partners. In 2021, this program has been finalized and closed, and the transfer of the long-term activities to operating teams has been completed.
Permanent Level 1 controls, carried out on operations performed by BUs and the SUs, ensure the security and quality of transactions and the operations. These controls are defined as a set of provisions constantly implemented to ensure the regularity, validity, and security of the operations carried out at operational level.
■any combination of actions and/or devices that may limit the likelihood of a risk occurring or reduce the consequences for the Company: these include controls carried out on a regular and permanent basis by the businesses or by automated systems during the processing of transactions, automated or non-automated security rules and controls that are part of transaction processing, or controls included in operational procedures. Also falling into this category are the organizational arrangements (e.g., segregation of duties) or governance, training actions, when they directly contribute to controlling certain risks;
■controls performed by managers: line managers control the correct functioning of the devices for which they are responsible. As such, they must apply formal procedures on a regular basis to ensure that employees comply with rules and procedures, and that Level 1 controls are carried out effectively.
Defined by a Group entity within its scope, Level 1 controls include controls (automated or manual) that are integrated into the processing of operations, proximity controls included in operating procedures, safety rules, etc. They are carried out in the course of their daily activities by agents directly in charge of an activity or by their managers. These controls aim to:
■ensure the proper enforcement of existing procedures and control of all risks related to processes, transactions and/or accounts;
Permanent Level 1 controls are set by management and avoid, as far as possible, situations of self-assessment. They are defined in the procedures and must be traced without necessarily being formalized, e.g. preventive automated controls that reject transations that do not comply with system-programmed rules.
In order to coordinate the operational risk management system and the permanent Level 1 control system, the BUs/SUs deploy a specific department called CORO (Controls & Operational Risks Office Department).
■the scope includes all permanent Level 1 checks, including managerial supervision checks and checks carried out by dedicated teams;
■this review and these audits aim to give an opinion on (i) the effectiveness of Level 1 controls, (ii) the quality of their implementation, (iii) their relevance (including, in terms of risk prevention), (iv) the definition of their modus operandi, (v) the relevance of remediation plans implemented following the detection of anomalies, and the quality of their follow-up, and thus contribute to the evaluation of the effectiveness of Level 1 controls.
The permanent level 2 control, control of the controls, is carried out by teams independent of the operational.
These controls are performed centrally by dedicated teams within Risk Service Unit (RISQ/CTL), Compliance Service Unit (CPLE/CTL) and Finance Service Unit (DFIN/CTL) and locally by the second-level control teams within the BU/SUs or entities.
Reporting to the Group Head of Inspection and Audit, the Inspection and Audit Service Unit (IGAD) is the Group’s third line of defense.
The IGAD Service Unit comprises General Inspection (IGAD/INS), Internal Audit Departments (IGAD/AUD) and a support function (IGAD/COO). To fulfill its mandate, the Group’s IGAD Service Unit has adequate resources from a qualitative and quantitative point of view. The Group’s Inspection and Audit Service Unit has about 1,100 employees.
The Group Head of Inspection and Audit reports directly to the Group Chief Executive Officer, with whom it holds regular meetings. The Group Head of Inspection and Audit meets regularly with the Chairman of the Board of Directors. The Audit and Internal Control Committee and the Risk Committee refer to the Group Head of Inspection and Audit on their initiative or at his request on any subject. The Group Head of Inspection and Audit participates in the Internal Control Committee and the Risk Committee meetings. Moreover, bilateral meetings are held as needed between the Group Head of Inspection and Audit and the chairpersons of these Committees.
The Inspection and Audit Service Unit (IGAD) is part of the Group’s internal control framework. IGAD carries out an internal audit mandate through its missions. In its role as the third line of defense, it is strictly independent from the Group’s business units and permanent control functions.
In line with standards set by the IIA (Institute of Internal Auditors), IGAD’s internal audit mandate is defined as an independent and objective activity that provides the Group with assurance as to how effectively it is controlling its operations, advises on improvements and contributes to the creation of added value. By carrying out this mandate, Inspection and Internal Audit help the Group to achieve its targets by evaluating systematically and methodically its processes for risk management, control and corporate governance and making recommendations to increase their efficiency.
The Inspection and Audit Service Unit exercises a key role in the Group’s risk management set-up and can assess any of its components.
Under this mandate, the General Inspection and Internal Audit assess (i) the quality of risk management within an audited scope, (ii) the permanent control framework is adequately structured and effective, (iii) management’s risk awareness and compliance with conduct rules and expected professional practices.
Whilst Audit Departments perform solely an internal audit role, General Inspection has, in addition to its internal audit role, a mandate to undertake other assignments such as any type of analysis or research, be involved in the assessment of strategic projects or intervene on specific subjects as requested by General Management. Such assignments, limited with regards to resources dedicated to them, are carried out within a framework ensuring that ethical principles defined in Institute of Internal Auditors’ Standards are being met.
The General Inspection also supervises the rollout of data-analysis initiatives within the scope of Inspection and Audit activities. This mission is ensured via a dedicated data-lab (INS/DAT), under the responsibility of an Inspection Managing Director (Inspecteur principal). The General Inspection also supervises and coordinates the Service Unit’s relationship with regulators.
IGAD centrally has six distinct Audit Departments. Each of these Audit Departments is placed under the supervision of a Head of internal Audit responsible for the auditing on a specific scope of activities. A matrix organization allows coverage of the main cross-business issues at Group level. In France, the Internal Audit teams are hierarchically linked to the Inspection unit. Audit Department heads based in branches or affiliates overseas report to the local entity’s head. However, in their internal audit role they report directly to the Internal Audit Head in charge of their region or entity.
Inspection and Audit teams work together on an annual risk assessment to define the Inspection and Audit plans for the upcoming year. IGAD teams regularly work together on joint assignments. They issue recommendations to correct issues identified in risk management and generally improve operations and risk management. IGAD teams are subsequently in charge of monitoring the effective implementation of these recommendations.
-
4.2 CONTROL OF THE PRODUCTION AND PUBLICATION OF FINANCIAL MANAGEMENT INFORMATION
■the Board of Directors, and more specifically its Audit and Internal Control Committee, has the task of examining the draft financial statements which are to be submitted to the Board, as well as verifying the conditions under which they were prepared and ensuring not only the relevance but also the consistency of the accounting principles and methods applied. The Audit and Internal Control Committee’s remit also is to monitor the independence of the Statutory Auditors, and the effectiveness of the internal control, measurement, supervision and control systems for risk related to the accounting and financial processes. The Statutory Auditors meet with the Audit and Internal Control Committee during the course of their assignment;
■the Group Finance Division gathers the accounting and management data compiled by the subsidiaries and the Business Units/Services Units in a set of standardized reports. It consolidates and verifies this information so that it can be used in the overall management of the Group and disclosed to third parties (supervisory bodies, investors, etc.). It also has a team in charge of the preparation of the Group regulatory reports.
-managing its assets and liabilities, and consequently defining, managing and controlling the Group’s financial position and structural risks,
-defining accounting and regulatory standards, frameworks, principles and procedures for the Group, and ensuring that they are observed,
■the Finance Divisions of subsidiaries and Business Units/Services Units carry out certification of the accounting data and entries booked by the back offices and of the management data submitted by the front offices. They are accountable for the financial statements and regulatory information required at the local level and submit reports (accounting data, finance control, regulatory reports, etc.) to the Group Finance Division. They can perform these activities on their own or else delegate their tasks to Shared Service Centers operating in finance and placed under Group Finance Division governance;
■the Risk Division consolidates the risk monitoring data from the Group’s Business Units/Services Units and subsidiaries in order to control credit, market and operational risks. This information is used in Group communications to the Group’s governing bodies and to third parties. Furthermore, it ensures in collaboration with the Group Finance Division, its expert role on the dimensions of credit risk, structural liquidity risks, rates, exchange rates, on the issues of recovery and resolution and the responsibility of certain closing processes, notably the production of solvency ratios;
■the Back offices are responsible for all support functions to front offices and ensure contractual settlements and deliveries. Among other responsibilities, they check that financial transactions are economically justified, book transactions and manage means of payment.
Local financial statements are drawn up in accordance with local accounting standards, and the consolidated Group financial statements are prepared in accordance with the standards defined by the Group Finance Division, which are based on IFRS as adopted by the European Union.
The applicable standards on solvency and liquidity, promulgated by the Basel Committee, were translated into European law by a directive (CRD4) and a regulation (CRR). They were completed by the Regulation CRR2 and the Directive CRD5 which entered into force on 28 June 2019. These texts are supplemented by several delegated acts and implementation technical standards. As the Societe Generale Group is identified as a “financial conglomerate”, it is subjected to additional supervision.
The Group Finance Division has dedicated teams that monitor the applicable standards and draft new internal standards to comply with any changes in the accounting and regulatory framework.
Each entity in the consolidation scope of the Group prepares its own accounting and management statements on a monthly basis. This information is then consolidated each month at Group level and published for the markets on a quarterly basis. Data reported are subject to analytical reviews and consistency checks performed by Finance Divisions or delegated to financial shared service centers acting under their responsibility and sent to the Group Finance Division. The Group Finance Division forwards the consolidated financial statements, Management Reports and regulatory statements to General Management and any interested third parties.
In practice, procedures have been tailored to the growing complexity of products and regulations. Moreover, specific adaptation action plans can be implemented where necessary.
The quality and objectivity of the accounting and management data are ensured by the separation of sales functions and all the functions of operational processing and follow-up of the operations: back offices and middle offices integrated into Resources Division and teams in charge of result production integrated into Finance Division. These teams carry out a series of controls defined by Group procedures on financial and accounting data, in particular:
■reconciliation of accounting and management data, using specific procedures, respecting the specified deadlines;
■for market activities, reconciliation between the accounting result, produced by the Finance Division and the economic result, produced by a dedicated expert department in the Risk Division.
Given the increasing complexity of the Group’s financial activities and organization, staff training and IT tools are regularly upgraded to ensure that the production and verification of accounting and management data are effective and reliable.
In practice, the internal control procedures implemented in the Group’s businesses are designed to guarantee the quality of financial and accounting information, and notably to:
■ensure that transactions are correctly assigned to the corresponding fiscal period and recorded in the accounts in accordance with the applicable accounting regulations, and that the accounting aggregates used to prepare the Group financial statements are compliant with the regulations in force;
■ensure the inclusion of all entities that must be consolidated in accordance with Group regulations;
■check that the operational risks associated with the production and transmission of accounting data through the IT system are correctly controlled, that the necessary adjustments are accurately performed, that the reconciliation of accounting and management data is satisfactory, and that the flows of cash payments and other items generated by transactions are exhaustive and adequate.
The Finance Department of each subsidiary checks the accuracy and consistency of the financial statements with respect to the relevant accounting frameworks (local standards and IFRS for subsidiaries, as well as French standards for branches). It performs checks to guarantee the accuracy of the information disclosed.
The data received for consolidation from each subsidiary are drawn from corporate accounting data by the subsidiaries after they have been locally brought into compliance with Group accounting principles.
Each subsidiary must be able to explain the transition from the Company financial statements to the financial statements reported through the consolidation tool.
The Finance Departments of the Business Units/Services Units have a dedicated department for financial management and control.
Financial shared service centers perform the first-level controls necessary to ensure the reliability of accounting, tax and regulatory information on the financial statements they produce in accordance with local and IFRS standards and notably data quality and consistency checks (equity, securities, foreign exchange, financial aggregates from the balance sheet and income statement, deviations from standards), justification and certification of the financial statements under their responsibility, intercompany reconciliation of the financial statements, regulatory statement checks and verification of evidence of tax charges and balances (current, deferred and duties).
These controls are declared as part of the managerial supervision and Group accounting certification processes.
These controls allow the Shared Services Centers to provide all necessary information to the Finance Departments of Business Units/Services Units and the Group Finance and Accounting Division to ensure the reliability and consistency of the accounts prepared.
Once the financial statements prepared by the entities have been restated according to Group standards, they are entered into a central database and processed to produce the consolidated statements.
The service in charge of consolidation in the Group Accounting Officer Department checks that the consolidation scope complies with the applicable accounting standards and performs multiple checks on data received for consolidation purposes. These checks include:
Last, this service ensures that the overall consolidation process has been conducted properly by performing analytical reviews of the summary data and verifying the consistency of the main aggregates of the financial statements. Changes in shareholders’ equity, goodwill, provisions and any deferred taxes consolidated in the fiscal year are also analyzed.
A team in this department is in charge of managing and coordinating the quarterly Group accounting certification framework to certify first-level controls on a quarterly basis (internal control certification).
The Group Finance Division has also a dedicated team, it which is responsible for ensuring second-level permanent controls on all Finance processes and for implementing the framework within the Group. Its mission is to ensure the effectiveness, quality and relevance of the Level 1 control framework by assessing it through process or activity reviews, testing controls and quarterly certifications. The team, reporting directly to the Group Finance Division, also reports to the Head of Permanent & Internal Control Division of Societe Generale Group.
The operational staff monitor their activity via a permanent supervision process under the direct responsibility of their management teams, repeatedly verifying the quality of the controls carried out on accounting data and the associated accounting treatment.
Internal Audit and the General Inspection define their audits and inspections using a risk-based approach and define an annual work program (Inspection and Audit plan schedule - plan de tournée). As part of their assignments, teams may verify the quality of the control environment contributing to the quality of the accounting and management data produced by the audited entities. They may check a certain number of accounts and assess the reconciliations between accounting and management data, as well as the quality of the permanent supervision procedures for the production and control of accounting data. They also assess the performance of IT tools and the accuracy of manual processing.
The department in charge of auditing the Group’s Central Divisions is responsible for auditing the Group Finance Division. Within that department, a distinct team, placed under the responsibility of a dedicated Audit Business Correspondent monitors and animates audit work related to accounting and financial matters on a Group-wide basis. The team provides expertise in identifying the Group’s main accounting risks and develops training sessions and methodologies to help share expertise in the auditing of accounting risks.
Audit missions pertaining to accounting matters are carried out by that team, for the subjects considered as the most material for the accuracy of the Group’s accounting information, as well as by Audit Departments based in the Group’s entities.
-
5 CAPITAL MANAGEMENT AND ADEQUACY
This section provides details on capital resources, regulatory requirements and the composition of the leverage ratio.
Evolution of CET1 capital
+ EUR 2.5 bn*
(between 2020 and 2021)
Evolution of total regulatory capital
+ EUR 0.9 bn*
CET1 ratio at end 2021
13.7 %*
* Figures taking into account the IFRS 9 phasing (fully-loaded CET1 ratio of 13.55% at end 2021, the phasing effect being +16 bps)
-
5.1 REGULATORY FRAMEWORK
Since January 2014, Societe Generale has been applying the Basel 3 regulations implemented in the European Union through a regulation and a directive (CRR and CRD4 respectively).
■Pillar 1 sets the minimum solvency, leverage and liquidity requirements and defines the rules that banks must use to measure risks and calculate the related capital requirements, according to standard or more advanced methods;
■Pillar 2 concerns the discretionary supervision implemented by the competent authority, which allows them – based on a constant dialogue with supervised credit institutions – to assess the adequacy of capital requirements as calculated under Pillar 1, and to calibrate additional capital requirements taking into account all the risks to which these institutions are exposed;
■Pillar 3 encourages market discipline by developing a set of qualitative or quantitative disclosure requirements which will allow market participants to better assess a given institution’s capital, risk exposure, risk assessment processes and, accordingly, capital adequacy.
Several amendments to European regulatory standards were adopted in May 2019 (CRR2/CRD5). The majority of the provisions came into force in June 2021.
■NSFR: The text introduces the regulatory requirements for the NSFR ratio. A ratio of 100% must now be respected from June 2021;
■Leverage ratio: the minimum requirement of 3% to which will be added, from 2023, 50% of the buffer required as a systemic institution;
■Derivatives counterparty risk (SA-CCR): the “SA-CCR” method is the Basel method replacing the “CEM” method for determining prudential exposure to derivatives in a standard approach;
■Large Risks: the main change is the calculation of the regulatory limit (25%) on Tier 1 (instead of total own funds), as well as the introduction of a specific cross-limit on systemic institutions (15%);
■TLAC: The ratio requirement for G-SIBs is introduced in CRR. In accordance with the Basel text, G-SIBs must respect an amount of own funds and eligible debt equal to the highest between 16%+weighted risk capital buffers and 6% of leverage exposure in 2019, with the ratio increasing to 18%+risk-weighted buffers and 6.75% leverage in 2022.
With regard to the implementation of the market risk reform (FRTB), after the publication of the first revised standard in January 2016 and of the consultation in March 2018 on this subject, the Basel Committee published in January 2019 its final text: BCBS457. In March 2020, the Basel Committee announced a one-year delay in the implementation of FRTB (1 January 2023 instead of 1 January 2022 as originally planned in the January 2019 text).
-for the Internal Model Approach (IMA), reporting should start three years after the publication in the Official Journal of the European Union (OJEU) of three technical standards (RTS) of the EBA, which are expected for Q1 2022;
■the capital requirements for FRTB: a two-year postponement (i.e. to 1 January 2027) could be applied in the event of unlevel playing field with the United States.
In December 2017, the Group of Central Bank Governors and Heads of Supervision (GHOS), the Basel Committee’s oversight body, endorsed the regulatory reforms aiming to complete Basel 3.
A first version of the transposition text was published by the European Commission on 27 October 2021 (“CRR3 - CRD6”) and will serve as support for the European Trialogue. The text will then have to be voted on by Parliament to become applicable.
These new rules, which were to take effect from 2022, have been postponed to January 2025 with an overall output floor: the risk-weighted assets (RWA) will be floored to a percentage of the standard method (credit, market and operational). The output floor level will increase gradually, from 50% in 2025 to 72.5% in 2030.
In the face of the health crisis and of its economic and financial consequences, a number of measures have been taken by the supervisory and regulatory authorities in 2020. Some of them are still in force. For example, the ECB announced the possibility to operate below the conservation cushion (CCB), as well as the countercyclical (CCyB) and the Systemic Risk Buffer (0% in France) ones.
Besides, the European Parliament and the Council reached an agreement through the CRR “quick fix” regulation, implemented as of 30 June 2020 part of whose provisions consisted in anticipating the implementation of CRR2/CRD5 measures that improve banks’ CET1 capital. The “quick fix” has postponed the implementation of the leverage buffer (0.5% for the Group) from 1 January 2022 to 1 January 2023 to be in line with the recommendation of the Basel Committee.
In 2021, the level of additional capital requirements in respect of Pillar 2 (P2R or “Pillar 2 Requirement”), effective since 1 March 2019, remained at 1.75%. In 2022, the European Central Bank notified the level of requirement in respect of P2R (Pillar 2 Requirement) for Societe Generale, which will apply from 1 March 2022. This level stands at 2.12%, including the additional requirement regarding Pillar 2 prudential expectations on the provisioning of non-performing loans granted before 26 April 2019.
Detailed information on the G-SIB requirements and other prudential information are available on the Group website, www.societe generale.com.
-
5.2 CAPITAL MANAGEMENT
As part of its capital management, the Group (under the managment of the Finance Division and the supervision of Risk Division) ensures that its solvency level is always compatible with the following objectives:
■allocating adequate capital to the various businesses, according to the Group’s strategic objectives;
■meeting the expectations of its various stakeholders: supervisors, debt and equity investors, rating agencies, and shareholders.
The Group determines its internal solvency targets in accordance with these objectives and regulatory thresholds.
The Group has an internal process for assessing the adequacy of its capital that measures and explains the evolution of the Group’s capital ratios over time, taking into account any future regulatory constraints and changes in the scope.
This process is based on a selection of key metrics that are relevant to the Group in terms of risk and capital measurement, such as CET1, Tier 1 and Total Capital ratios. These regulatory indicators are supplemented by an assessment of the coverage of internal capital needs by available CET1 capital, thus confirming the relevance of the targets set in the risk appetite. Besides, this assessment takes into account the constraints arising from the other metrics of the risk appetite, such as rating, MREL and TLAC or leverage ratio.
All of these indicators are measured on a forward-looking basis in relation to their target on a quarterly or even monthly basis for the current year. During the preparation of the financial plan, they are also assessed on an annual basis over a minimum of three-year horizon according to a baseline and adverse scenarios, in order to demonstrate the resilience of the bank’s business model against adverse macroeconomic and financial environments. Capital adequacy is continuously monitored by the Executive Management and by the Board of Directors as part of the Group’s corporate governance process and is reviewed in depth during the preparation of the financial plan. It ensures that the bank always complies with its financial target with a buffer above the “Maximum Distributable Amount” (MDA) threshold.
Besides, the Group maintains a balanced capital allocation among its three strategic core businesses:
Each of the Group’s core businesses accounts for around a third of total Risk-Weighted Assets (RWA), with a predominance of credit risk (84% of total Group RWA, including counterparty credit risk).
As at 31 December 2021, Group RWA were up 3% to EUR 363 billion, compared with EUR 352 billion at end December 2020.
The evolution of the business lines’ RWA is at the heart of the operational management of the Group’s capital trajectory based on a detailed understanding of the vectors of variations. Where appropriate, the General Management may decide, upon a proposal from the Finance Division, to implement managerial actions to increase or reduce the share of the business lines, for instance by validating the execution of synthetic securitisation or of disposals of performing or non-performing portfolios.
-
5.3 SCOPE OF APPLICATION – PRUDENTIAL SCOPE
The Group’s prudential reporting scope includes all fully consolidated entities, with the exception of insurance entities, which are subject to separate capital supervision.
All regulated entities of the Group comply with their prudential commitments on an individual basis.
Non-regulated entities outside of the scope of prudential consolidation are subject to periodic reviews, at least annually.
The following table provides the main differences between the accounting scope (consolidated Group) and the prudential scope (Banking Regulation requirements).
Type of entity
Accounting treatment
Prudential treatment
Entities with a finance activity
Full consolidation
Full consolidation
Entities with an Insurance activity
Full consolidation
Equity method
Holdings with a finance activity by nature
Equity method
Equity method
Joint ventures with a finance activity by nature
Equity method
Proportional consolidation
The following table provides a reconciliation between the consolidated balance sheet and the accounting balance sheet within the prudential scope. The amounts presented are accounting data, not a measure of RWA, EAD or prudential capital. Prudential filters related to entities and holdings not associated with an insurance activity are grouped together on account of their non-material weight (< 0.1%).
Return on assets (i.e. net income divided by the balance sheet total as per the consolidated financial statements) for Societe Generale stood at 0.39% in 2021 and -0.02% in 2020. On a prudential basis, this ratio was 0.43% in 2021 and -0.02% in 2020, calculated by dividing the Group net income by the balance sheet total for prudential purposes (data in the table below).
ASSETS at 31.12.2021
(In EURm)
Balance sheet as
in published
financial
statements
Prudential
restatements
linked to
insurance(1)
Prudential
restatements
linked to
consolidation
methods
Balance sheet
under regulatory
scope of
consolidation
Reference to
table 14 (CC1)
Cash, due from banks
179,969
(0)
0
179,969
Financial assets at fair value through profit or loss
342,714
11,128
(0)
353,842
Hedging derivatives
13,239
30
-
13,269
Financial assets at fair value through other comprehensive income
43,450
(0)
-
43,450
Securities at amortised cost
19,371
(0)
-
19,371
Due from banks at amortised cost
55,972
(0)
90
56,062
1
o.w. subordinated loans to credit institutions
99
(0)
-
99
Customer loans at amortised cost
497,164
1,575
(6)
498,733
Revaluation differences on portfilios hedged against interest rate risk
131
-
-
131
Investment of insurance activities
178,898
(178,898)
-
-
Tax assets
4,812
(195)
0
4,617
o.w. deferred tax assets that rely on future profitability excluding those arising from temporary differences
1,719
-
(622)
1,096
2
o.w. deferred tax assets arising from temporary differences
2,111
-
378
2,489
Other assets
92,898
(2,654)
114
90,357
o.w. defined-benefit pension fund assets
85
-
-
85
3
Non-current assets held for sale
27
-
-
27
Investments accounted for using the equity method
95
4,629
(76)
4,649
Tangible and intangible assets
31,968
(163)
0
31,805
o.w. intangible assets exclusive of leasing rights
2,733
-
(134)
2,599
4
Goodwill
3,741
(325)
-
3,416
4
TOTAL ASSETS
1,464,449
(164,873)
121
1,299,698
(1)Restatement of entities excluded from the prudential scope and reconsolidation of intra-group transactions relating to these entities.
LIABILITIES at 31.12.2021
(In EURm)
Balance sheet as
in published
financial
statements
Prudential
restatements
linked to
insurance(1)
Prudential
restatements
linked to
consolidation
methods
Balance sheet
under regulatory
scope of
consolidation
Reference to
table 14 (CC1)
Due to central banks
5,152
-
-
5,152
Financial liabilities at fair value through profit or loss
307,563
1,854
-
309,418
Hedging derivatives
10,425
4
-
10,429
Debt securities issued
135,324
432
-
135,757
Due to banks
139,177
(2,574)
49
136,652
Customer deposits
509,133
1,002
(121)
510,013
Revaluation differences on portfolios hedged against interest rate risk
2,832
-
-
2,832
Tax liabilities
1,577
(299)
0
1,279
Other Liabilities
106,305
(8,962)
193
97,536
Non-current liabilities held for sale
1
-
-
1
Liabilities related to insurance activities contracts
155,288
(155,288)
-
-
Provisions
4,850
(23)
-
4,827
Subordinated debts
15,959
40
-
15,999
o.w. redeemable subordinated notes including revaluation differences on hedging items
15,519
42
-
15,561
5
TOTAL DEBTS
1,393,586
(163,813)
122
1,229,894
Subtotal Equity, Group share
65,067
(202)
(0)
64,865
6
Issued common stocks, equity instruments and capital reserves
29,447
1
-
29,448
Retained earnings
30,631
(203)
(0)
30,428
Net income
5,641
0
-
5,641
Unrealised or deferred capital gains and losses
(652)
0
(0)
(653)
Minority interests
5,796
(858)
-
4,939
7
TOTAL EQUITY
70,863
(1,060)
(0)
69,804
TOTAL LIABILITIES
1,464,449
(164,873)
121
1,299,698
(1)Restatement of entities excluded from the prudential scope and reconsolidation of intra-group transactions relating to these entities.
Some accounting work detailed in Chapter 6 of the 2022 Universal Registration Document (as well as in the Group’s financial statements published on 10 February 2022) have led to the restatement of comparative data on the balance sheet as at 31 December 2020. The main impact (amounting to EUR 17.5 billion) is linked with the review of the offsets between financial assets and liabilities done by the Group in 2021, enabling the identification of revaluations of transaction derivatives wrongly recognised on the liabilities side of the balance sheet instead of being booked in reduction of the assets and conversely, as well as inconsistencies in the accounting schemes of the macro hedging activities with the same impacts on the presentation of the balance sheet.
ASSETS at 31.12.2020
(In EURm)
Balance sheet
as in published
financial
statements
Prudential
restatements
linked to
insurance(1)
Prudential
restatements linked
to consolidation
methods
Balance sheet
under
regulatory scope
of consolidation
Reference to
table 14 (CC1)
Cash, due from banks
168,179
(0)
0
168,179
Financial assets at fair value through profit or loss
411,916
10,966
(0)
422,882
Hedging derivatives
20,667
22
-
20,689
Financial assets at fair value through other comprehensive income
52,060
(0)
-
52,060
Securities at amortised cost
15,635
(0)
-
15,635
Due from banks at amortised cost
53,380
0
214
53,594
1
o.w. subordinated loans to credit institutions
97
(0)
-
97
Customer loans at amortised cost
448,761
1,543
(5)
450,299
Revaluation differences on portfilios hedged against interest rate risk
378
-
-
378
Investment of insurance activities
166,854
(166,854)
-
-
Tax assets
4,995
(88)
0
4,907
o.w. deferred tax assets that rely on future profitability excluding those arising from temporary differences
1,840
-
(613)
1,227
2
o.w. deferred tax assets arising from temporary differences
2,261
-
436
2,697
Other assets
67,341
(2,529)
50
64,862
o.w. defined-benefit pension fund assets
52
-
-
52
3
Non-current assets held for sale
6
-
-
6
Investments accounted for using the equity method
100
4,668
(76)
4,692
Tangible and intangible assets
30,088
(166)
0
29,922
o.w. intangible assets exclusive of leasing rights
2,485
-
(140)
2,345
4
Goodwill
4,044
(325)
-
3,719
4
TOTAL ASSETS
1,444,404
(152,763)
183
1,291,824
(1)Restatement of entities excluded from the prudential scope and reconsolidation of intra-group transactions relating to these entities.
LIABILITIES at 31.12.2020
(In EURm)
Balance sheet
as in published
financial
statements
Prudential
restatements
linked to
insurance(1)
Prudential
restatements linked
to consolidation
methods
Accounting
balance sheet
within the
prudential scope
Reference to
table 14 (CC1)
Due to central banks
1,489
-
-
1,489
Financial liabilities at fair value through profit or loss
372,705
2,031
-
374,736
Hedging derivatives
12,461
10
-
12,471
Debt securities issued
138,957
823
-
139,780
Due to banks
135,571
(2,710)
43
132,904
Customer deposits
456,059
1,438
(58)
457,439
Revaluation differences on portfolios hedged against interest rate risk
7,696
-
-
7,696
Tax liabilities
1,227
(294)
0
933
Other Liabilities
84,937
(6,881)
198
78,254
Non-current liabilities held for sale
-
-
-
-
Liabilities related to insurance activities contracts
146,126
(146,126)
-
-
Provisions
4,732
(20)
-
4,712
Subordinated debts
15,432
40
-
15,472
o.w. redeemable subordinated notes including revaluation differences on hedging items
15,001
40
-
15,041
5
TOTAL DEBTS
1,377,392
(151,690)
183
1,225,885
Subtotal Equity, Group share
61,710
(202)
(0)
61,508
6
Issued common stocks, equity instruments and capital reserves
31,628
0
-
31,628
Retained earnings
32,102
(202)
(0)
31,900
Net income
(258)
(0)
-
(258)
Unrealised or deferred capital gains and losses
(1,761)
(0)
(0)
(1,762)
Minority interests
5,302
(871)
-
4,431
7
TOTAL EQUITY
67,012
(1,074)
(0)
65,938
TOTAL LIABILITIES
1,444,404
(152,763)
183
1,291,824
(1)Restatement of entities excluded from the prudential scope and reconsolidation of intra-group transactions relating to these entities.
Company
Activity
Country
Antarius
Insurance
France
ALD RE Designated Activity Company
Insurance
Ireland
Catalyst RE International LTD
Insurance
Bermuda
Société Générale Strakhovanie Zhizni LLC
Insurance
Russia
Sogelife
Insurance
Luxembourg
SG Strakhovanie LLC
Insurance
Russia
Sogecap
Insurance
France
Komercni Pojstovna A.S.
Insurance
Czech Republic
La Marocaine Vie
Insurance
Morocco
Oradea Vie
Insurance
France
SGL RE
Insurance
Luxembourg
Société Générale RE SA
Insurance
Luxembourg
Sogessur
Insurance
France
Banque Pouyanne
Bank
France
Generally, all regulated Group undertakings are subject to solvency requirements set by their respective supervisory authorities. Regulated financial entities and affiliates outside of Societe Generale’s prudential consolidation scope are all in compliance with their respective solvency requirements. As a general principle, all banks should be under a double supervision, on a standalone basis and on a consolidated basis but the CRR allows, under specific conditions, waivers from the requirements on an individual basis granted by the competent authorities.
The supervisory authority accepted that some Group entities may be exempted from the application of prudential requirements on an individual basis or, where applicable, on a sub-consolidated basis. Terms and conditions of waiver of requirements granted by supervisors include a commitment to provide these subsidiaries with the Group’s support to ensure their overall solvency and liquidity, as well as a commitment to ensure that they are managed prudently according to the applicable banking regulations.
The conditions for applying waivers regarding monitoring on an individual basis for a Parent Institution, as far as solvency and large exposure ratios are concerned, are defined by the CRR, which stipulates that two conditions have to be met:
■there is no significant obstacle, in law or in fact, current or anticipated, to the prompt transfer of equity capital or the rapid repayment of liabilities to the Parent Institution in a Member State;
■the risk assessment, measurement and control procedures that are useful for the purposes of supervision on a consolidated basis cover the Parent Institution in a Member State.
Accordingly, for instance, Societe Generale SA is not subject to prudential requirements on an individual basis.
Any transfer of equity or repayment of liabilities between the parent company and its entities is carried out in compliance with capital and liquidity requirements that are locally applicable. The obligation to comply with such requirements may affect the capacity of subsidiaries to transfer funds to the parent company.
-
5.4 REGULATORY CAPITAL
Reported in accordance with International Financial Reporting Standards (IFRS), Societe Generale’s regulatory capital consists of the following components.
According to the applicable regulations, Common Equity Tier 1 capital is made up primarily of the following:
■ordinary shares (net of repurchased shares and treasury shares) and related share premium accounts;
■any positive difference between expected losses on customer loans and receivables managed under the internal ratings-based (IRB) approach, and the sum of related value adjustments and collective impairment losses;
■securitisation exposures weighted at 1,250%, when these positions are excluded from the calculation of RWA.
According to CRR/CRD4 regulations, Additional Tier 1 capital is made up of deeply subordinated notes that are issued directly by the Bank, and have the following features:
■these instruments are perpetual and constitute unsecured, deeply subordinated obligations. They rank junior to all other obligations of the Bank, including undated and dated subordinated debt, and senior only to common stock shareholders;
■Societe Generale may elect, on a discretionary basis, not to pay the interest and coupons linked to these instruments. This compensation is paid out of distributable items;
■they might be haircut or converted when in resolution or independently of a resolution measurement;
■subject to the prior approval of the European Central Bank, Societe Generale has the option to redeem these instruments at certain dates, but no earlier than five years after their issuance date.
■any positive difference between the sum of value adjustments and impairment losses on customer loans and receivables exposures managed under the IRB approach and expected losses, up to 0.6% of total credit RWA under the IRB approach;
■value adjustments for credit risk related to collective impairment losses on customer loans and receivables exposures managed under the standardised approach, up to 1.25% of total credit RWA.
All capital instruments and their features are detailed online (www.societegenerale.com/en/measuring-our-performance/information-and-publications/registration-documents).
(1)The undated deeply subordinated notes’ remuneration will be paid from the distributable profits for the purposes of the consolidated prudential regulation.
Issuance
Date
Currency
Issue amount
(in currency m)
First call
date
Yield before the call
date and frequency
Yield after the call
date and frequency
Book value
(EURm) at
31.12.2021
Book value
(EURm) at
31.12.2020
18.12.2013
USD
1 750 M
18.12.2023
7.875% annually
Mid Swap Rate USD
5 years + 4.979%1,545
1,426
07.04.2014
EUR
1 000 M
07.04.2021
6.750% annually
Mid Swap Rate EUR
5 years + 5.538%-
1,000
29.09.2015
USD
1 250 M
29.09.2025
8.000% annually
Mid Swap Rate USD
5 years + 5.873%1,104
1,019
13.09.2016
USD
1 500 M
13.09.2021
7.375% annually
Mid Swap Rate USD
5 years + 6.238%-
1,222
06.04.2018
USD
1250 M
06.04.2028
6.750% annually
Mid Swap Rate USD
5 years + 3.929%1,104
1,019
04.10.2018
USD
1250 M
04.10.2023
7.375% annually
Mid Swap Rate USD
5 years + 4.302%1,104
1,019
16.04.2019
SGD
750 M
16.04.2024
6.125% annually
Swap Offer Rate SGD
5 years + 4.207%491
462
12.09.2019
AUD
700 M
12.09.2024
4.875% annually
Mid Swap S/Q AUD
5 years + 4.036%448
440
18.11.2020
USD
1 500 M
18.11.2030
5.375% annually
5y U.S. Treasury Rate
+ 4.514%1,324
1,222
26.05.2021
USD
1 000 M
26.05.2026
4.750% annually
5y U.S. Treasury Rate
+ 3.931%883
1,222
TOTAL
8,003
8,830
(In EURm)
31.12.2020
Issues
Redemptions
Prudential
supervision
valuation
haircut
Others
31.12.2021
Debt instruments eligible for Tier 1
8,830
883
(2,222)
-
512
8,003
Debt instruments eligible for Tier 2
12,587
2,011
(1,630)
(1,512)
364
11,820
TOTAL ELIGIBLE DEBT INSTRUMENTS
21,417
2,894
(3,852)
(1,512)
876
19,823
The solvency ratios are set by comparing the Group’s equity (Common Equity Tier 1 (CET1), Tier 1 (T1) or Total Capital (TC)) with the sum of risk-weighted credit exposures and the capital requirement multiplied by 12.5 for market and operational risks. They are expressed as a percentage of RWA and according to the split of own funds i.e.: Common Equity Tier 1 (CET1), Tier 1 (T1) or Total Capital (TC).
Each quarter, the ratios are calculated following the accounting closing and then compared to the supervisory requirements.
The Pillar 1 regulatory minimum capital requirement is set at 4.5% for CET1, 6% for T1 and 8% for TC. This minimum remains stable over time.
The minimum Pillar 2 requirement (P2R) is set by the supervisor following the Supervisory Review and Evaluation Process (SREP). It has been standing at 1.75% since 1 March 2019 and until 28 February 2022. From 1 March 2022, this level will stand at 2.12%, including the additional requirement regarding Pillar 2 prudential expectations on the provisioning of non-performing loans granted before 26 April 2019.
■the mean of the countercyclical buffer rates of each country, weighted by the relevant credit risk exposures in these countries. As of 1 January 2022, Societe Generale’s countercyclical buffer is equal to 0.04%;
■the conservation buffer in force as of 1 January 2016 with a maximum level standing at 2.50% since 1 January 2019;
As at 1 January 2022, taking into account the combined regulatory buffers, the phased-in CET1 ratio level that would trigger the Maximum Distributable Amount (MDA) mechanism stands at 9.02%. It will stand at 9.23% from 1 March 2022.
01.03.2022
01.01.2022
01.01.2021
Minimum requirement for Pillar 1
4.50%
4.50%
4.50%
Minimum requirement for Pillar 2 (P2R)(1)
1.19%
0.98%
0.98%
Minimum requirement for countercyclical buffer
0.04%
0.04%
0.04%
Minimum requirement for conservation buffer
2.50%
2.50%
2.50%
Minimum requirement for systemic buffer
1.00%
1.00%
1.00%
Minimum requirement for CET1 ratio
9.23%
9.02%
9.02%
(1)As per article 104a of the CRD5 directive, a minimum of 56% of P2R add-on has to be covered by CET1 capital (instead of 100% previously) and 75% by Tier 1 capital.
(In EURm)
31.12.2021
31.12.2020
Shareholders’ equity (IFRS), Group share
65,067
61,684
Deeply subordinated notes
(8,003)
(8,830)
Perpetual subordinated notes
(0)
(264)
Group consolidated shareholders’ equity net of deeply subordinated and perpetual subordinated notes
57,064
52,590
Non-controlling interests
4,762
4,378
Intangible assets
(1,828)
(1,647)
Goodwill
(3,408)
(3,710)
Dividends proposed (to the General Meeting) and interest expenses on deeply subordinated and perpetual subordinated notes
(2,345)
(557)
Deductions and regulatory adjustments
(4,410)
(3,764)
COMMON EQUITY TIER 1 CAPITAL
49,835
47,290
Deeply subordinated notes and preferred shares
8,003
8,830
Other additional Tier 1 capital
206
195
Additional Tier 1 deductions
(137)
(136)
TOTAL TIER 1 CAPITAL
57,907
56,179
Tier 2 instruments
11,820
12,587
Other Tier 2 capital
287
240
Tier 2 deductions
(1,527)
(1,422)
Total regulatory capital
68,487
67,584
TOTAL RISK-WEIGHTED ASSETS
363,371
351,852
Credit and counterparty credit risk-weighted assets
304,922
287,324
Market risk-weighted assets
11,643
15,340
Operational risk-weighted assets
46,806
49,188
Solvency ratios
Common Equity Tier 1 ratio
13.71%
13.44%
Tier 1 ratio
15.94%
15.97%
Total capital ratio
18.85%
19.21%
(1)Ratios set in accordance with CRR2/CRD5 rules as published in June 2019, including Danish compromise for insurance, and taking into account the IFRS 9 phasing (fully-loaded CET1 ratio of 13.55% as at 31 December 2021, the phasing effect being +16 bps).
The solvency ratio as at 31 December 2021 stood at 13.7% in Common Equity Tier 1 (13.4% at 31 December 2020) and 15.9% in Tier 1 (16.0% at 31 December 2020) for a total ratio of 18.8% (19.2% at 31 December 2020).
Group shareholders’ equity at 31 December 2021 totalled EUR 65.1 billion (compared with EUR 61.7 billion at 31 December 2020).
After taking into account non-controlling interests and regulatory adjustments, CET1 regulatory capital was EUR 49.8 billion at 31 December 2021, vs. EUR 47.3 billion at 31 December 2020. The Additional Tier One deductions mainly regard authorisations to buy back own Additional Tier 1 capital instruments as well as subordinated bank and insurance loans.
(In EURm)
31.12.2021
31.12.2020
Unrecognised minority interests
(2,860)
(2,507)
Deferred tax assets
(1,096)
(1,226)
Prudent Valuation Adjustment
(911)
(884)
Adjustments related to changes in the value of own liabilities
254
289
Other
203
564
TOTAL CET1 REGULATORY DEDUCTIONS AND ADJUSTMENTS
(4,410)
(3,764)
The prudential deductions and restatements included in the “Other” category essentially involve the following:
■any positive difference between expected losses on customer loans and receivables managed under the internal ratings-based (IRB) approach, and the sum of related value adjustments and impairment losses;
-
5.5 RISK-WEIGHTED ASSETS AND CAPITAL REQUIREMENTS
The Basel 3 Accord has established the rules for calculating minimum capital requirements in order to more accurately assess the risks to which banks are exposed, taking into account the risk profile of transactions via two approaches intended for determining RWA: a standardised approach and an advanced one based on internal methods modelling the counterparties’ risk profiles.
Risk-weighted
assets
Total own funds
requirements
(In EURm)
31.12.2021
30.09.2021
31.12.2020
31.12.2021
Credit risk (excluding counterparty credit risk)
271,012
262,308
255,431
21,681
o.w. standardised approach
103,323
98,931
92,771
8,266
o.w. Foundation IRB (FIRB) approach
4,121
4,162
4,417
330
o.w. slotting approach
752
701
795
60
o.w. equities under the simple risk-weighted approach
3,515
3,159
3,355
281
o.w. other equities under IRB approach
18,189
18,583
18,586
1,455
o.w. Advanced IRB (AIRB) approach
141,111
136,772
135,507
11,289
Counterparty credit risk – CCR
27,478
31,725
26,330
2,198
o.w. standardised approach(1)
9,304
10,457
5,588
744
o.w. internal model method (IMM)
13,088
14,906
15,767
1,047
o.w. exposures to a CCP
1,273
1,516
1,263
102
o.w. credit valuation adjustment – CVA
2,807
3,867
3,131
225
o.w. other CCR
1,007
979
581
81
Settlement risk
63
6
77
5
Securitisation exposures in the non-trading book (after the cap)
6,368
5,960
5,486
509
o.w. SEC-IRBA approach
2,082
2,033
2,233
167
o.w. SEC-ERBA incL IAA
3,978
3,571
2,951
318
o.w. SEC-SA approach
308
356
301
25
o.w. 1,250%/deductions
-
-
-
-
Position, foreign exchange and commodities risks (Market risk)
11,643
14,276
15,340
931
o.w. standardised approach
1,419
1,761
1,728
114
o.w. IMA
10,225
12,515
13,612
818
Large exposures
-
-
-
-
Operational risk
46,806
49,232
49,188
3,744
o.w. basic indicator approach
-
-
-
-
o.w. standardised approach
2,412
2,294
2,250
193
o.w. advanced measurement approach
44,394
46,938
46,938
3,552
Amounts (included in the “credit risk” section above) below the thresholds for deduction (subject to 250% risk weight)
7,344
7,570
8,008
588
TOTAL
363,371
363,508
351,852
29,070
(1)The amounts of RWA as at 31 December 2021 and as at 30 September 2021 correspond to the new SA-CCR approach, following the application of Regulation (EU) No 2019/876 (CRR2). The equivalent amount as at 31 December 2020 is featured here according to the former Current exposure method (CEM).
(In EURbn)
Credit and
counterparty credit
Market
Operational
Total
31.12.2021
Total
31.12.2020
French Retail Banking
91.8
0.1
3.7
95.5
98.9
International Retail Banking and Financial Services
112.1
0.1
5.5
117.7
108.0
Global Banking and Investor Solutions
89.3
11.5
30.3
131.2
125.9
Corporate Centre
11.7
0.0
7.3
19.0
19.1
Group
304.9
11.6
46.8
363.4
351.9
■credit and counterparty credit risks accounted for 84% of RWA (of which 37% for International Retail Banking and Financial Services);
■operational risk accounted for 13% of RWA (of which 65% for Global Banking and Investor Solutions).
(In EURm)
Crédit du Nord
Rosbank
Komerčni Banka
IRB
Standard
IRB
Standard
IRB
Standard
Credit and counterparty credit risks
16,982
3,136
796
9,016
12,465
2,092
Sovereign
3
0
746
1
65
2
Financial institutions
154
3
-
560
766
244
Corporate
9,524
1,029
-
4,724
7,631
1,219
Retail
5,436
956
-
3,316
3,882
118
Equity investments
1,681
84
49
0
121
0
Other non-credit obligation assets
-
1,063
-
415
-
509
Securitisation
186
-
-
-
-
-
Market risk
85
30
81
Operational risk
917
1,198
612
TOTAL 2021
21,120
11,039
15,251
TOTAL 2020
21,409
9,652
13,217
-
5.6 TLAC AND MREL RATIOS
The Total Loss Absorbing Capacity (TLAC) requirement which applies to Societe Generale is 16% of RWA until 1 January 2022 and 18% of RWA thereafter, to which the conservation buffer of 2.5%, the G-SIB buffer of 1% and the countercyclical buffer must be added. As at 31 December 2021, the global TLAC requirement thus stood at 19.54% of Group RWA.
The TLAC rule also provides for a minimum ratio of 6% of the leverage exposure from 2019 before reaching 6.75% of the leverage exposure starting from January 2022.
As at 31 December 2021, Societe Generale reached a phased-in TLAC ratio of 29.2% excluding senior preferred debts. The phased-in ratio stands at 31.1% of RWA when considering the possibility to account for senior preferred debts up to 2.5% of RWA and 9.5% of leverage exposure.
The quantitative information relating to the TLAC ratio can be found in Chapter 1 (synthesis) as well as in section 5.10 (details).
The Minimum Requirement for own funds and Eligible Liabilities (MREL) has applied to credit institutions and investment firms within the European Union since 2016.
-
5.7 LEVERAGE RATIO
The Group calculates its leverage ratio according to the CRR2 rules applicable since June 2021 (except those regarding G-SIBs expected to be applicable from January 2023).
Managing the leverage ratio means both calibrating the amount of Tier 1 capital (the numerator of the ratio) and controlling the Group’s leverage exposure (the denominator of the ratio) to achieve the target ratio levels that the Group sets for itself. To this end, the leverage exposure of the different businesses is monitored by the Finance Division.
The Group aims to maintain a consolidated leverage ratio that is significantly higher than the 3.5% minimum set in the Basel Committee’s recommendations, transposed in Europe via CRR2, including a fraction of the systemic buffer which is applicable to the Group.
As at 31 December 2021, the leverage ratio of Societe Generale stood at 4.9%, considering a Tier 1 capital amount of EUR 57.9 billion compared with a leverage exposure of EUR 1,189 billion (versus 4.8% as at 31 December 2020, with EUR 56.2 billion and EUR 1,179 billion respectively).
Compared with 31 December 2020, the leverage exposure has increased by EUR 11 billion. The contribution to the leverage exposure of on-balance sheet exposures excluding derivatives and SFTs increased by EUR 49 billion over the year, driven by the sustained growth of customer loans outstanding which was supported by the favourable credit granting conditions. The off-balance sheet followed the same trend, with an annual growth reaching EUR 14 billion. These rises were supplemented by that of derivatives exposures, increasing by EUR 10 billion, which reflects in particular the change in the calculation methodology for derivatives valuation, i.e the replacement of the former CEM methodology by the SA-CCR one. Conversely, SFT exposures showed a EUR 26 billion decrease as compared to December 2020, owing to a slowdown in the reverse repos activity. Another downward factor mitigating the overall increase of the leverage exposure resides in the more substantial volume of the various regulatory exemptions, displaying a EUR 36 billion variation (of which more than half came from central bank exemptions). The amounts mentioned in this paragraph can be found in section 5.10.
(In EURm)
31.12.2021
31.12.2020
Tier 1 capital(2)
57,907
56,179
Total assets in prudential balance sheet(3)
1,299,698
1,291,824
Adjustments for derivative financial instruments
8,619
(60,054)
Adjustments for securities financing transactions(4)
14,896
5,988
Off-balance sheet exposure (loan and guarantee commitments)
118,263
104,034
Technical and prudential adjustments(5)
(252,223)
(163,248)
o.w. central banks exemption
(117,664)
(98,192)
Leverage ratio exposure
1,189,253
1,178,543
Leverage ratio
4.87%
4.77%
(1)Ratio set in accordance with CRR2 rules and taking into account the IFRS 9 phasing (leverage ratio of 4.82% without phasing as at 31 December 2021, the phasing effect being +5 bps).
(2)The capital overview is available in table 15.
(3)The prudential balance sheet corresponds to the IFRS balance sheet less entities accounted for through the equity method (mainly insurance subsidiaries). Data as at 31 December 2020 modified in accordance with the accounting restatements of comparative data described as an accompaniement to table 10.
(4)Securities financing transactions: repurchase transactions, securities lending or borrowing transactions and other similar transactions.
(5)The breakdown of adjustments as at 31 December 2020 takes into account a methodological change leading to the reclassification of some miscellaneous adjustments (previously classified on the line relating to derivatives) onto the line “Technical and prudential adjustments”.
-
5.8 LARGE EXPOSURES RATIO
The CRR incorporates the provisions regulating large exposures. As such, Societe Generale must not have any exposure towards a single beneficiary which exceeds 25% of the Group’s capital.
The final rules of the Basel Committee on large exposures, transposed in Europe via CRR2, have been applicable since June 2021. The main changes compared with CRR reside in the calculation of the regulatory limit (25%), henceforth expressed as a proportion of Tier 1 (instead of cumulated Tier 1 and Tier 2), and in the introduction of a cross-specific limit on systemic institutions (15%).
-
5.9 FINANCIAL CONGLOMERATE RATIO
The Societe Generale group, also identified as a “Financial conglomerate”, is subject to additional supervision from the ECB.
As at 31 December 2021, Societe Generale’s financial conglomerate equity covered the solvency requirements for both banking and insurance activities.
As at 30 June 2021, the financial conglomerate ratio was 151%, consisting of a numerator “Own funds of the Financial Conglomerate” of EUR 76.1 billion, and a denominator “Regulatory requirement of the Financial Conglomerate” of EUR 50.5 billion.
As at 31 December 2020, the financial conglomerate ratio was 153%, consisting of a numerator “Own funds of the Financial Conglomerate” of EUR 75.1 billion, and a denominator “Regulatory requirement of the Financial Conglomerate” of EUR 49.2 billion.
-
5.10 ADDITIONAL QUANTITATIVE INFORMATION
ON OWN FUNDS AND CAPITAL ADEQUACY(In EURm)
31.12.2021
30.09.2021
30.06.2021
31.03.2021
31.12.2020
AVAILABLE CAPITAL (AMOUNTS)
1
Common Equity Tier 1 (CET1) capital
49,835
47,752
48,315
47,082
47,290
2
Common Equity Tier 1 (CET1) capital as if IFRS 9 or analogous ECLs transitional arrangements had not been applied
49,223
47,044
47,568
46,262
46,374
3
Tier 1 capital
57,907
55,620
57,258
55,318
56,179
4
Tier 1 capital as if IFRS 9 or analogous ECLs
transitional arrangements had not been applied57,295
54,912
56,510
54,498
55,263
5
Total capital
68,487
66,432
69,331
66,858
67,584
6
Total capital as if IFRS 9 or analogous ECLs
transitional arrangements had not been applied67,875
65,724
68,583
66,038
66,668
RISK-WEIGHTED ASSETS (AMOUNTS)
7
Total risk-weighted assets
363,371
363,508
361,488
353,063
351,852
8
Total risk-weighted assets as if IFRS 9 or analogous ECLs transitional arrangements had not been applied
363,216
363,356
361,373
353,416
352,380
CAPITAL RATIOS
9
Common Equity Tier 1 (as a percentage of RWA)
13.71%
13.14%
13.37%
13.34%
13.44%
10
Common Equity Tier 1 (as a percentage of RWA) as if IFRS 9 or analogous ECLs transitional arrangements had not been applied
13.55%
12.95%
13.16%
13.09%
13.16%
11
Tier 1 (as a percentage of RWA)
15.94%
15.30%
15.84%
15.67%
15.97%
12
Tier 1 (as a percentage of RWA) as if IFRS 9 or analogous ECLs transitional arrangements had not been applied
15.77%
15.11%
15.64%
15.42%
15.68%
13
Total capital
(as a percentage of RWA)18.85%
18.28%
19.18%
18.94%
19.20%
14
Total capital
(as a percentage of RWA)
as if IFRS 9 or analogous ECLs transitional arrangements had not been applied18.69%
18.09%
18.98%
18.69%
18.92%
LEVERAGE RATIO
15
Leverage ratio total exposure measure
1,189,253
1,263,831
1,243,050
1,241,437
1,178,543
16
Leverage ratio
4.87%
4.40%
4.61%
4.46%
4.77%
17
Leverage ratio as if IFRS 9 or analogous ECLs transitional arrangements had not been applied
4.82%
4.35%
4.55%
4.43%
4.69%
(1)Leverage ratio total exposure measure taking into account the IFRS 9 transitional provisions as well as the option to exempt some central bank exposures over the whole historical period considered.
(In EURm)
31.12.2021
30.06.2021
Amounts
Source based
on reference
numbers of the
balance sheet
under the
regulatory
scope of
consolidation
Amounts
Source based
on reference
numbers of the
balance sheet
under the
regulatory
scope
of consolidation
COMMON EQUITY TIER 1 (CET1) CAPITAL: INSTRUMENTS AND RESERVES
1
Capital instruments and the related share premium accounts
21,006
6
21,006
6
of which fully paid up capital instruments
1,067
1,067
of which share premium
19,939
19,939
2
Retained earnings
5,535
6
5,832
6
3
Accumulated other comprehensive income (and other reserves)
25,347
6
25,070
6
EU-3a
Funds for general banking risk
-
-
4
Amount of qualifying items referred to in Article 484 (3) and the related share premium accounts subject to phase out from CET1
-
-
5
Minority interests (amount allowed in consolidated CET1)
1,902
7
1,881
7
EU-5a
Independently reviewed interim profits net of any foreseeable charge or dividend
3,297
6
1,153
6
6
Common Equity Tier 1 (CET1) capital before regulatory adjustments
57,087
54,942
COMMON EQUITY TIER 1 (CET1) CAPITAL: REGULATORY ADJUSTMENTS
7
Additional value adjustments (negative amount)
(911)
(910)
8
Intangible assets (net of related tax liability) (negative amount)
(5,236)
4
(5,276)
4
10
Deferred tax assets that rely on future profitability excluding those arising from temporary differences (net of related tax liability where the conditions in Article 38 (3) are met) (negative amount)
(1,096)
2
(1,127)
2
11
Fair value reserves related to gains or losses on cash flow hedges of financial instruments that are not valued at fair value
(173)
(174)
12
Negative amounts resulting from the calculation of expected loss amounts
-
-
13
Any increase in equity that results from securitised assets (negative amount)
-
-
14
Gains or losses on liabilities valued at fair value resulting from changes in own credit standing
256
265
15
Defined-benefit pension fund assets (negative amount)
(132)
3
(73)
3
16
Direct and indirect holdings by an institution of own CET1 instruments (negative amount)
(517)
(40)
17
Direct, indirect and synthetic holdings of the CET 1 instruments of financial sector entities where those entities have reciprocal cross holdings with the institution designed to inflate artificially the own funds of the institution (negative amount)
-
-
18
Direct, indirect and synthetic holdings by the institution of the CET1 instruments of financial sector entities where the institution does not have a significant investment in those entities (amount above 10% threshold and net of eligible short positions) (negative amount)
(0)
-
19
Direct, indirect and synthetic holdings by the institution of the CET1 instruments of financial sector entities where the institution has a significant investment in those entities (amount above 10% threshold and net of eligible short positions) (negative amount)
(0)
-
EU-20a
Exposure amount of the following items which qualify for a RW of 1,250%, where the institution opts for the deduction alternative
(45)
(37)
EU-20b
of which qualifying holdings outside the financial sector (negative amount)
-
-
EU-20c
of which securitisation positions (negative amount)
(45)
(37)
EU-20d
of which free deliveries (negative amount)
-
-
21
Deferred tax assets arising from temporary differences (amount above 10% threshold, net of related tax liability where the conditions in Article 38 (3) are met) (negative amount)
0
-
22
Amount exceeding the 17,65% threshold (negative amount)
(0)
-
23
of which direct, indirect and synthetic holdings by the institution of the CET1 instruments of financial sector entities where the institution has a significant investment in those entities
-
-
25
of which deferred tax assets arising from temporary differences
-
-
EU-25a
Losses for the current financial year (negative amount)
-
-
EU-25b
Foreseeable tax charges relating to CET1 items except where the institution suitably adjusts the amount of CET1 items insofar as such tax charges reduce the amount up to which those items may be used to cover risks or losses (negative amount)
-
-
27
Qualifying AT1 deductions that exceed the AT1 items of the institution (negative amount)
-
-
27a
Other regulatory adjusments
601
746
28
Total regulatory adjustments to Common Equity Tier 1 (CET1)
(7,252)
(6,626)
29
Common Equity Tier 1 (CET1) capital
49,835
48,315
ADDITIONAL TIER 1 (AT1) CAPITAL: INSTRUMENTS
30
Capital instruments and the related share premium accounts
5,354
5,118
31
of which classified as equity under applicable accounting standards
8,003
6
8,905
6
32
of which classified as liabilities under applicable accounting standards
-
-
33
Amount of qualifying items referred to in Article 484 (4) and the related share premium accounts subject to phase out from AT1 as described
in Article 486(3) of CRR-
-
EU-33a
Amount of qualifying items referred to in Article 494a(1) subject to phase out from AT1
-
-
EU-33b
Amount of qualifying items referred to in Article 494b(1) subject to phase out from AT1
2,649
3,787
34
Qualifying Tier 1 capital included in consolidated AT1 capital (including minority interests not included in row 5) issued by subsidiaries and held by third parties
206
7
174
7
35
of which instruments issued by subsidiaries subject to phase out
-
-
36
Additional Tier 1 (AT1) capital before regulatory adjustments
8,209
9,079
ADDITIONAL TIER 1 (AT1) CAPITAL: REGULATORY ADJUSTMENTS
37
Direct and indirect holdings by an institution of own AT1 instruments (negative amount)
(125)
(125)
38
Direct, indirect and synthetic holdings of the AT1 instruments of financial sector entities where those entities have reciprocal cross holdings with the institution designed to inflate artificially the own funds of the institution (negative amount)
-
-
39
Direct, indirect and synthetic holdings of the AT1 instruments of financial sector entities where the institution does not have a significant investment in those entities (amount above 10% threshold and net of eligible short positions) (negative amount)
-
-
40
Direct, indirect and synthetic holdings by the institution of the AT1 instruments of financial sector entities where the institution has a significant investment in those entities (net of eligible short positions) (negative amount)
(12)
1
(11)
1
42
Qualifying T2 deductions that exceed the T2 items of the institution (negative amount)
-
-
42a
Other regulatory adjustments to AT1 capital
-
-
43
Total regulatory adjustments to Additional Tier 1 (AT1) capital
(137)
(136)
44
Additional Tier 1 (AT1) capital
8,072
8,943
45
Tier 1 capital (T1 = CET1 + AT1)
57,907
57,258
TIER 2 (T2) CAPITAL: INSTRUMENTS
46
Capital instruments and the related share premium accounts
5,923
5
5,789
5
47
Amount of qualifying items referred to in Article 484 (5) and the related share premium accounts subject to phase out from T2 as described in Article 486 (4) CRR
-
-
EU-47a
Amount of qualifying items referred to in Article 494a (2) subject to phase out from T2
-
-
EU-47b
Amount of qualifying items referred to in Article 494b (2) subject to phase out from T2
5,896
5
7,465
5
48
Qualifying own funds instruments included in consolidated T2 capital (including minority interests and AT1 instruments not included in rows 5 or 34) issued by subsidiaries and held by third parties
287
7
259
7
49
of which instruments issued by subsidiaries subject to phase out
-
-
50
Credit risk adjustments
366
478
51
Tier 2 (T2) capital before regulatory adjustments
12,473
13,991
TIER 2 (T2) CAPITAL: REGULATORY ADJUSTMENTS
52
Direct and indirect holdings by an institution of own T2 instruments and subordinated loans (negative amount)
(150)
(150)
53
Direct, indirect and synthetic holdings of the T2 instruments and subordinated loans of financial sector entities where those entities have reciprocal cross holdings with the institution designed to inflate artificially the own funds
of the institution (negative amount)-
-
54
Direct and indirect holdings of the T2 instruments and subordinated loans of financial sector entities where the institution does not have a significant investment in those entities (amount above 10% threshold and net of eligible short positions) (negative amount)
0
-
55
Direct and indirect holdings by the institution of the T2 instruments and subordinated loans of financial sector entities where the institution
has a significant investment in those entities (net of eligible short positions) (negative amount)(1,743)
1
(1,768)
1
EU-56a
Qualifying eligible liabilities deductions that exceed the eligible liabilities items of the institution (negative amount)
-
-
56b
Other regulatory adjusments to T2 capital
-
-
57
Total regulatory adjustments to Tier 2 (T2) capital
(1,893)
(1,918)
58
Tier 2 (T2) capital
10,580
12,073
59
Total capital (TC = T1 + T2)
68,487
69,331
60
Total RWA
363,371
361,488
CAPITAL RATIOS AND REQUIREMENTS INCLUDING BUFFERS
61
Common Equity Tier 1 (as a percentage of RWA)
13.71%
13.37%
62
Tier 1 (as a percentage of RWA)
15.94%
15.84%
63
Total capital (as a percentage of total RWA)
18.85%
19.18%
64
Institution CET1 overall capital requirement (CET1 requirement in accordance with Article 92 (1) CRR, plus additional CET1 requirement which the institution is required to hold in accordance with point (a) of Article 104(1) CRD, plus combined buffer requirement in accordance with Article 128(6) CRD) expressed as a percentage of RWA)
9.02%
9.02%
65
of which capital conservation buffer requirement
2.50%
2.50%
66
of which countercyclical buffer requirement
0.04%
0.04%
67
of which systemic risk buffer requirement
-
-
EU-67a
of which Global Systemically Important Institution (G-SII) or Other Systemically Important Institution (O-SII) buffer
1.00%
1.00%
EU-67b
of which additional own funds requirements to address the risks other than the risk of excessive leverage
0.98%
0.98%
68
Common Equity Tier 1 available to meet buffer (as a percentage of RWA)
8.23%
7.88%
AMOUNTS BELOW THE THRESHOLDS FOR DEDUCTION (BEFORE RISK WEIGHTING)
72
Direct and indirect holdings of own funds and eligible liabilities of financial sector entities where the institution does not have a significant investment in those entities (amount below 10% threshold and net of eligible short positions)
2,706
3,644
73
Direct and indirect holdings by the institution of the CET1 instruments of financial sector entities where the institution has a significant investment in those entities (amount below 17.65% thresholds and net of eligible short positions)
450
504
75
Deferred tax assets arising from temporary differences (amount below 17.65% threshold, net of related tax liability where the conditions in Article 38 (3) are met)
2,488
2,648
APPLICABLE CAPS ON THE INCLUSION OF PROVISIONS IN TIER 2
76
Credit risk adjustments included in T2 in respect of exposures subject to standardised approach (prior to the application of the cap)
-
-
77
Cap on inclusion of credit risk adjustments in T2 under standardised approach
1,354
1,297
78
Credit risk adjustments included in T2 in respect of exposures subject to internal ratings-based approach (prior to the application of the cap)
366
478
79
Cap for inclusion of credit risk adjustments in T2 under internal ratings-based approach
1,117
1,100
CAPITAL INSTRUMENTS SUBJECT TO PHASE-OUT ARRANGEMENTS (ONLY APPLICABLE BETWEEN 1 JANUARY 2014 AND 1 JANUARY 2022)
80
Current cap on CET1 instruments subject to phase out arrangements
-
-
81
Amount excluded from CET1 due to cap (excess over cap after redemptions and maturities)
-
-
82
Current cap on AT1 instruments subject to phase out arrangements
-
-
83
Amount excluded from AT1 due to cap (excess over cap after redemptions and maturities)
-
-
84
Current cap on T2 instruments subject to phase out arrangements
-
-
85
Amount excluded from T2 due to cap (excess over cap after redemptions and maturities)
-
-
The regulatory own funds items are used as a starting point to describe differences between balance sheet items used to calculate own funds and regulatory own funds.
3.Other comprehensive income from changes in the fair value through equity of financial assets are not deducted from regulatory own funds, except gains and losses on derivatives held as cash flow hedges;
4.The differences between the amounts of the balance sheet under the prudential scope and under regulatory capital are related to taxes deferred on OCA and DVA;
5.Goodwill and other intangible assets net of related deferred tax liabilities are fully deducted from regulatory own funds;
6.Gains or losses on liabilities valued at fair value and recognised in the income statement resulting from changes in own credit spread (OCA) as well as gains or losses resulting from changes in credit spread on own liability derivatives (DVA) are deducted from Common Equity Tier 1 instruments.
7.Differences between balance sheet items used to calculate own funds and regulatory own funds are referring to the translation differences associated with these instruments;
8.Minority interests recognised in Additional Tier 1 instruments receive the same accounting treatment as described in Note 2.
9.Discrepancy due to the exclusion of insurance subordinated loans in the consolidated balance sheet.
11.Minority interests recognised in Tier 2 instruments receive the same accounting treatment as described in Note 2.
(in EURm)
31.12.2021
30.06.2021
OWN FUNDS AND ELIGIBLE LIABILITIES AND ADJUSTMENTS
1
Common Equity Tier 1 capital (CET1)
49,835
48,315
2
Additional Tier 1 capital (AT1)
8,072
8,943
6
Tier 2 capital (T2)
10,580
12,073
11
Own funds for the purpose of Articles 92a CRR and 45 BRRD
68,487
69,331
OWN FUNDS AND ELIGIBLE LIABILITIES: NON-REGULATORY CAPITAL ELEMENTS
12
Eligible liabilities instrumentsissued directly by the resolution entity that are subordinated to excluded liabilities (not grandfathered)
34,183
32,425
EU-12a
Eligible liabilities instruments issued by other entities within the resolution group that are subordinated to excluded liabilities (not grandfathered)
-
-
EU-12b
Eligible liabilities instruments that are subordinated to excluded liabilities, issued prior to 27 June 2019 (subordinated grandfathered)
-
-
EU-12c
Tier 2 instruments with a residual maturity of at least one year to the extent they do not qualify as Tier 2 items
3,507
2,652
13
Eligible liabilities that are not subordinated to excluded liabilities (not grandfathered pre cap)
5,217
2,854
EU-13a
Eligible liabilities that are not subordinated to excluded liabilities issued prior to 27 June 2019 (pre-cap)
1,703
3,057
14
Amount of non subordinated instruments eligible, where applicable after application of Article 72b (3) CRR
6,921
5,910
17
Eligible liabilities items before adjustments
44,612
40,987
EU-17a
of which subordinated
37,691
35,076
OWN FUNDS AND ELIGIBLE LIABILITIES: ADJUSTMENTS TO NON-REGULATORY CAPITAL ELEMENTS
18
Own funds and eligible liabilities items before adjustments
113,098
110,318
19
(Deduction of exposures between MPE resolution groups)
-
-
20
(Deduction of investments in other eligible liabilities instruments)
-
-
22
Own funds and eligible liabilities after adjustments
113,098
110,318
RWA AND LEVERAGE EXPOSURE MEASURE OF THE RESOLUTION GROUP
23
Total RWA
363,371
361,488
24
Total exposure measure
1,189,253
1,243,050
RATIO OF OWN FUNDS AND ELIGIBLE LIABILITIES
25
Own funds and eligible liabilities (as a percentage of total RWA)
31.12%
30.52%
26
Own funds and eligible liabilities (as a percentage of total exposure measure)
9.51%
8.87%
27
CET1 (as a percentage of TREA) available after meeting the resolution group’s requirements
8.23%
10.98%
28
Institution-specific combined buffer requirement
3.54%
3.54%
29
of which capital conservation buffer requirement
2.50%
2.50%
30
of which countercyclical buffer requirement
0.04%
0.04%
31
of which systemic risk buffer requirement
-
-
EU-31a
of which Global Systemically Important Institution (G-SII) or
Other Systemically Important Institution (O-SII) buffer1.00%
1.00%
MEMORANDUM ITEMS
EU-32
Total amount of excluded liabilities referred to in Article 72a(2) CRR
907,968
939,378
(In EURm)
31.12.2021
Insolvency ranking
Sum of
1 to 13
1
2
4
5
6
10
13
(most
junior)
(most
senior)
1
Description of insolvency
ranking(2)Common
Equity
Tier 1
(CET1)
capitalAdditional
Tier 1
(AT1)
capital
and Tier
2 (T2)
capitalSenior
Non-
Preferred
debtSenior
Preferred
debtDeposits
Secured
debtEmployees
wage claims2
Liabilities and own funds
49,835
22,159
37,570
508,863
135,844
266,698
1,821
1,022,791
3
o.w. excluded liabilities
-
-
-
343,508
135,844
266,698
1,821
747,872
4
Liabilities and own funds less excluded liabilities
49,835
22,159
37,570
165,355
-
-
-
274,919
5
Subset of row 4 that are own funds and liabilities potentially eligible for meeting TLAC
49,835
22,159
34,183
7,223
-
-
-
113,400
6
o.w. residual maturity
≥ 1 year < 2 years-
3,392
4,221
1,598
-
-
-
9,211
7
o.w. residual maturity
≥ 2 year < 5 years-
7,939
16,072
2,854
-
-
-
26,865
8
o.w. residual maturity
≥ 5 years < 10 years-
1,075
13,829
2,694
-
-
-
17,598
9
o.w. residual maturity ≥ 10 years, but excluding perpetual securities
-
1,681
50
76
-
-
-
1,807
10
o.w. perpetual securities
49,835
8,072
-
-
-
-
-
57,907
(1)Scope of the resolution entity Societe Generale SA.
(2)For further details regarding the nature and definitions of creditor ranks as per French jurisdiction, please refer to the Single Resolution Board’s documentation (part 8, page 29): https://www.srb.europa.eu/system/files/media/document/LDR%20-%20Annex%20on%20Insolvency%20ranking%202021%20v1.6_1.pdf.
(In EURm)
30.06.2021
Insolvency ranking
Sum of
1 to 10
1
2
4
5
6
10
(most
junior)
(most
senior)
1
Description of insolvency ranking(2)
Common
Equity
Tier 1
(CET1)
capitalAdditional
Tier 1
(AT1)
capital
and Tier
2 (T2)
capitalSenior
Non-
Preferred
debtSenior
Preferred
debtDeposits
Secured
debt2
Liabilities and own funds
48,315
23,667
35,728
516,600
35,728
516,600
1,052,007
3
o.w. excluded liabilities
-
-
-
310,998
130,819
296,878
738,695
4
Liabilities and own funds less excluded liabilities
48,315
23,667
35,728
205,602
-
-
313,312
5
Subset of row 4 that are own funds and liabilities potentially eligible for meeting TLAC
48,315
23,667
32,425
5,910
-
-
110,318
6
o.w. residual maturity
≥ 1 year < 2 years-
2,761
1,730
2,925
-
-
7,416
7
o.w. residual maturity
≥ 2 year < 5 years-
8,850
16,259
1,702
-
-
26,811
8
o.w. residual maturity
≥ 5 years < 10 years-
1,705
14,386
1,283
-
-
17,374
9
o.w. residual maturity ≥ 10 years, but excluding perpetual securities
-
1,408
50
-
-
-
1,458
10
o.w. perpetual securities
48,315
8,943
-
-
-
-
57,258
(1)Scope of the resolution entity Societe Generale SA.
(2)For further details regarding the nature and definitions of creditor ranks as per French jurisdiction, please refer to the Single Resolution Board’s documentation (part 8, page 29): https://www.srb.europa.eu/system/files/media/document/LDR%20-%20Annex%20on%20Insolvency%20ranking%202021%20v1.6_1.pdf.
(In EURm)
31.12.2021
31.12.2020
1
Total assets as per published financial statements
1,464,449
1,444,404
2
Adjustment for entities which are consolidated for accounting purposes but are outside the scope of prudential consolidation
(164,752)
(152,580)
3
(Adjustment for securitised exposures that meet the operational requirements for the recognition of risk transference)
(2,874)
4
(Adjustment for temporary exemption of exposures to central bank (if applicable))
(117,664)
(98,192)
5
(Adjustment for fiduciary assets recognised on the balance sheet pursuant to the applicable accounting framework but excluded from the total exposure measure in accordance with point (i) of Article 429a(1) CRR)
-
-
6
Adjustment for regular-way purchases and sales of financial assets subject to trade date accounting
-
-
7
Adjustment for eligible cash pooling transactions
(2)
-
8
Adjustments for derivative financial instruments(1)
8,619
(60,054)
9
Adjustments for securities financing transactions “SFTs”
14,896
5,988
10
Adjustment for off-balance sheet items (ie conversion to credit equivalent amounts of off-balance sheet exposures)
118,263
104,034
11
(Adjustment for prudent valuation adjustments and specific and general provisions which have reduced Tier 1 capital)
-
EU-11a
(Adjustment for exposures excluded from the total exposure measure in accordance with point (c ) of Article 429a(1) CRR)
-
-
EU-11b
((Adjustment for exposures excluded from the total exposure measure in accordance with point (j) of Article 429a(1) CRR)
(18,768)
(17,087)
12
Other adjustments(2)
(112,915)
(47,970)
13
Total exposure measure
1,189,253
1,178,543
(1)Data as at 31 December 2020 modified in accordance with the accounting restatements of comparative data described as an accompaniement to table 10.
(2)Data as at 31 December 2020 taking into account a methodological change leading to the reclassification of some miscellaneous adjustments (previously classified on the line relating to derivatives) onto the line “Other adjustments”.
(In EURm)
31.12.2021
31.12.2020
ON-BALANCE SHEET EXPOSURES (EXCLUDING DERIVATIVES AND SFTS)
1
On-balance sheet items (excluding derivatives, SFTs and fiduciary assets, but including collateral)
1,009,966
953,170
2
(Gross-up for derivatives collateral provided where deducted from the balance sheet assets pursuant to the applicable accounting framework)
-
-
3
(Deductions of receivables assets for cash variation margin provided in derivatives transactions)
(25,233)
(18,273)
4
(Adjustment for securities received under securities financing transactions that are recognised as an asset)
-
-
5
(General credit risk adjustments to on-balance sheet items)
-
-
6
(Asset amounts deducted in determining Tier 1 capital)
(7,380)
(6,866)
7
Total on-balance sheet exposures (excluding derivatives, SFTs and fiduciary assets)
977,353
928,031
DERIVATIVE EXPOSURES
8
Replacement cost associated with SA-CCR derivatives transactions (i.e. net of eligible cash variation margin)
77,700
EU-8a
Derogation for derivatives: replacement costs contribution under the simplified standardised approach(1)
-
29,662
9
Add-on amounts for potential future exposure associated with SA-CCR derivatives transactions
141,694
EU-9a
Derogation for derivatives: Potential future exposure contribution under the simplified standardised approach(1)
-
88,717
EU-9b
Exposure determined under Original Exposure Method
-
-
10
(Exempted CCP leg of client-cleared trade exposures) (SA-CCR)
(117,990)
EU-10a
(Exempted CCP leg of client-cleared trade exposures) (simplified standardised approach)
-
-
EU-10b
(Exempted CCP leg of client-cleared trade exposures) (original exposure method)
-
(28,308)
11
Adjusted effective notional amount of written credit derivatives
85,359
101,932
12
(Adjusted effective notional offsets and add-on deductions for written credit derivatives)
(81,706)
(96,895)
13
Total derivative exposures
105,057
95,108
SECURITIES FINANCING TRANSACTION EXPOSURES
14
Gross SFT assets (with no recognition of netting), after adjusting for sales accounting transactions
218,293
239,598
15
(Netted amounts of cash payables and cash receivables of gross SFT assets)
(92,821)
(89,021)
16
Counterparty credit risk exposure for SFT assets
14,896
16,073
EU-16a
Derogation for SFTs: Counterparty credit risk exposure in accordance with Article 429b (4) and 222 of Regulation (EU) No 575/2013
-
-
17
Agent transaction exposures
-
-
EU-17a
(Exempted CCP leg of client-cleared SFT exposure)
-
-
18
Total securities financing transaction exposures
140,368
166,650
OTHER OFF-BALANCE SHEET EXPOSURES
19
Off-balance sheet exposures at gross notional amount
256,127
230,540
20
(Adjustments for conversion to credit equivalent amounts)
(137,527)
(126,506)
21
(General provisions deducted in determining Tier 1 capital and specific provisions associated with off-balance sheet exposures)
(337)
22
Other off-balance sheet exposures
118,263
104,034
EXCLUDED EXPOSURES
EU-22a
(Exposures excluded from the leverage ratio total exposure measure in accordance with point (c ) of Article 429a(1) CRR)
-
-
EU-22b
(Exposures exempted in accordance with point (j) of Article 429a(1) CRR) (on and off balance sheet)
(18,768)
(17,087)
EU-22c
(Excluded exposures of public development banks (or units) - Public sector investments)
-
-
EU-22d
(Excluded exposures of public development banks (or units) - Promotional loans)
-
-
EU-22e
(Excluded passing-through promotional loan exposures by non-public development banks (or units))
-
-
EU-22f
(Excluded guaranteed parts of exposures arising from export credits)
(12,482)
EU-22g
(Excluded excess collateral deposited at triparty agents)
-
-
EU-22h
(Excluded CSD related services of CSD/institutions in accordance with point (o) of Article 429a(1) CRR)
-
-
EU-22i
(Excluded CSD related services of designated institutions in accordance with point (p) of Article 429a(1) CRR)
-
-
EU-22j
(Reduction of the exposure value of pre-financing or intermediate loans)
(Other exempted exposures)(2)-
(120,538)
-
(98,192)EU-22k
(Total exempted exposures)
(151,788)
(115,279)
CAPITAL AND TOTAL EXPOSURES
23
Tier 1 capital
57,907
56,179
24
Total leverage ratio exposures
1,189,253
1,178,543
LEVERAGE RATIO
25
Leverage ratio (%)
4.87%
4.77%
EU-25
Leverage ratio (excluding the impact of the exemption of public sector investments and promotional loans) (%)
4.87%
4.77%
25a
Leverage ratio (excluding the impact of any applicable temporary exemption of central bank exposures) (%)
4.43%
4.40%
26
Regulatory minimum leverage ratio requirement (%)
3.09%
EU-26a
Additional own funds requirements to address the risk of excessive leverage (%)
-
EU-26b
of which to be made up of CET1 capital (%)
-
27
Leverage ratio buffer requirement (%)
-
EU-27a
Overall leverage ratio requirement (%)
3.09%
CHOICE ON TRANSITIONAL ARRANGEMENTS AND RELEVANT EXPOSURES
EU-27b
Choice on transitional arrangements for the definition of the capital measure
DISCLOSURE OF MEAN VALUES
28
Mean value of gross SFT assets, after adjustment for sale accounting transactions and netted of amounts of associated cash payables and cash receivables
185,546
29
Quarter-end value of gross SFT assets, after adjustment for sale accounting transactions and netted of amounts of associated cash payables and cash receivables
125,471
30
Total exposure measure (including the impact of any applicable temporary exemption of central bank reserves) incorporating mean values from row 28 of gross SFT assets (after adjustment for sale accounting transactions and netted of amounts of associated cash payables and cash receivables)
1,249,329
30a
Total exposure measure (excluding the impact of any applicable temporary exemption of central bank reserves) incorporating mean values from row 28 of gross SFT assets (after adjustment for sale accounting transactions and netted of amounts of associated cash payables and cash receivables)
1,366,993
31
Leverage ratio (including the impact of any applicable temporary exemption of central bank reserves) incorporating mean values from row 28 of gross SFT assets (after adjustment for sale accounting transactions and netted of amounts of associated cash payables and cash receivables)
4.64%
31a
Leverage ratio (excluding the impact of any applicable temporary exemption of central bank reserves) incorporating mean values from row 28 of gross SFT assets (after adjustment for sale accounting transactions and netted of amounts of associated cash payables and cash receivables)
4.24%
(1)Amount as at 31 December 2020 calculated via the original exposure method.
(2)Notably including the temporary central bank exemption amount.
(In EURm)
31.12.2021
31.12.2020
EU-1
Total on-balance sheet exposures (excluding derivatives, SFTs, and exempted exposures), of which:
832,980
819,617
EU-2
Trading book exposures(1)
122,145
63,619
EU-3
Banking book exposures, of which:
710,835
755,998
EU-4
Covered bonds
197
206
EU-5
Exposures treated as sovereigns(2)
168,690
181,674
EU-6
Exposures to regional governments, MDB, international organisations and PSE not treated as sovereigns
15,086
14,453
EU-7
Institutions
59,464
48,161
EU-8
Secured by mortgages of immovable properties
18,568
16,447
EU-9
Retail exposures
198,602
195,019
EU-10
Corporates
217,653
190,072
EU-11
Exposures in default
8,202
8,338
EU-12
Other exposures (eg equity, securitisations, and other non-credit obligation assets)
24,374
101,627
(1)Modification of the amount as at 31 December 2020 with a view to excluding all exposures relating to derivatives, in accordance with EBA technical instructions.
(2)Modification of the amount as at 31 December 2020 with a view to excluding exempted central bank exposures in accordance with EBA technical instructions.
The countercyclical capital buffer (or CCyB) rate is defined by country. The countercyclical capital buffer requirement is calculated by averaging the countercyclical rates of each country, weighted by the exposures relevant to credit risk in those countries. The countercyclical capital buffer rate came into effect on 1 January 2016, with a transitional period that ended in 2019. In France, the authority in charge of defining the countercyclical rate applicable to exposures in France and in charge of recognising any rates applicable in other countries is the High Council for Financial Stability (HCSF). The HCSF publishes quarterly the CCyB rate for France and the rates recognised for third countries. The rate applicable to the Group is recalculated whenever a country is subject to a rate change. As a result, there is no annual rate for this cushion, but a rate applicable on a given date.
(In EURm)
31.12.2021
General credit
exposures
Relevant credit
exposures –
Market risk
Securitisation
exposures –
Exposure
value for
non-trading
book
Total
exposure
value
Own fund requirements
RWA
Own
fund
require-
ments
weights
(%)
Counter-
cyclical
buffer
rate
(%)
Exposure
value under
the standar-
dised
approach
Exposure
value under
the IRB
approach
Sum of
long and
short
positions
of trading
book
exposures
for SA
Value of
trading
book
exposures
for internal
models
Relevant
credit
exposures
– Credit
risk
Relevant
credit
expo-
sures –
Market
risk
Relevant
credit
exposures
– Securiti-
sation
positions
in the non-
trading
book
Total
Europe
120,990
399,869
-
-
23,373
544,232
18,154
-
10
18,163
227,043
82.22%
Bulgaria
63
136
-
-
-
198
7
-
-
7
83
0.03%
0.50%
Czech Republic
3,447
31,442
-
-
-
34,890
1,074
-
-
1,074
13,428
4.86%
0.50%
Denmark
665
692
-
-
-
1,357
53
-
-
53
657
0.24%
-
France
51,956
262,077
-
-
14,196
328,230
10,587
-
4
10,591
132,393
47.94%
-
Norway
535
1,234
-
-
-
1,769
68
-
-
68
850
0.31%
1.00%
Slovakia
1,011
813
-
-
-
1,823
95
-
-
95
1,191
0.43%
1.00%
Sweden
733
1,247
-
-
-
1,980
83
-
-
83
1,032
0.37%
-
Ireland
266
6,352
-
-
1,074
7,692
123
-
1
124
1,552
0.56%
-
Iceland
0
7
-
-
-
7
0
-
-
0
1
0.00%
-
Lithuania
36
34
-
-
-
71
2
-
-
2
29
0.01%
-
Luxembourg
1,377
11,564
-
-
824
13,765
360
-
1
361
4,510
1.63%
0.50%
United Kingdom
8,448
15,302
-
-
1,589
25,339
809
-
2
811
10,139
3.67%
-
North America
3,153
64,030
-
-
17,255
84,437
1,514
-
14
1,528
19,105
6.92%
Asia-Pacific
1,872
22,051
-
-
3,437
27,361
581
-
4
585
7,315
2.65%
Hong-Kong
319
1,044
-
-
-
1,363
27
-
-
27
336
0.12%
1.00%
Rest of
the world20,695
21,194
-
-
20
41,909
1,814
-
0
1,814
22,674
8.21%
TOTAL
146,709
507,144
-
-
44,086
697,940
22,063
-
28
22,091
276,138
100.00%
0.04%
(In EURm)
31.12.2020
General credit
exposures
Relevant credit
exposures – Market
risk
Securitisation
exposures -
Exposure
value for
non-trading
book
Total
exposure
value
Own fund requirements
RWA
Own
fund
require-
ments
weights
(%)
Counter-
cyclical
buffer
rate
(%)
Exposure
value under
the standar-
dised
approachExposure
value
under
the IRB
approachSum of
long and
short
positions
of trading
book
exposures
for SAValue of
trading
book
exposures
for
internal
modelsRelevant
credit
exposures
– Credit
riskRelevant
credit
exposures
– Market
riskRelevant
credit
exposures
– Securiti-
sation
positions
in the
non-
trading
bookTotal
Europe
101,936
381,567
53
3,850
21,523
508,929
17,047
36
7
17,090
213,629
83.5%
Bulgaria
1
228
-
-
-
229
7
-
-
7
92
0.0%
0.50%
Czech Republic
3,281
26,667
-
-
-
29,948
955
-
-
955
11,934
4.7%
0.50%
Denmark
508
527
-
32
-
1,067
47
0
-
47
592
0.2%
0.00%
France
41,259
258,167
7
619
14,721
314,773
10,246
9
3
10,259
128,233
50.2%
0.00%
Norway
489
967
-
76
-
1,533
50
0
-
51
633
0.2%
1.00%
Slovakia
910
217
-
3
-
1,131
69
-
-
69
859
0.3%
1.00%
Sweden
593
961
-
254
-
1,807
65
1
-
66
822
0.3%
0.00%
Ireland
243
6,142
-
52
862
7,298
124
1
1
126
1,578
0.6%
0.00%
Iceland
0
0
-
-
-
0
0
-
-
0
0
0.0%
0.00%
Lithuania
13
25
-
-
-
38
1
-
-
1
11
0.0%
0.00%
Luxembourg
1,882
11,129
-
330
369
13,711
403
2
0
405
5,063
2.0%
0.25%
United Kingdom
6,810
14,541
-
799
1,653
23,804
666
7
1
674
8,421
3.3%
0.00%
North America
1,705
51,857
5,936
506
14,319
74,322
1,082
97
12
1,191
14,884
5.8%
Asia-Pacific
1,021
19,888
-
104
1,938
22,952
493
4
3
500
6,251
2.4%
Hong Kong
201
863
-
111
-
1,175
29
2
-
31
386
0.2%
1.00%
Rest of the world
19,162
18,763
-
230
148
38,302
1,669
5
0
1,674
20,929
8.2%
TOTAL
123,824
472,075
5,988
4,690
37,928
644,505
20,291
142
23
20,455
255,693
100.0%
0.04%
ASSETS at 31.12.2021
(In EURm)
Consolidated
balance sheet
(statutory
scope)
Consolidated
balance sheet
within the
prudential
scope
Subject to
credit risk
Subject to
counterparty
credit risk
Subject to the
securitisation
framework
Subject to
market risk
Not subject to
capital
requirements
or subject to
deduction
from capital
Cash, due from banks
179,969
179,969
177,510
-
-
-
2,459
Financial assets at fair value through profit or loss
342,714
353,842
33,045
192,231
-
320,797
-
Hedging derivatives
13,239
13,269
0
13,269
-
9
-
Financial assets at fair value through other comprehensive income
43,450
43,450
43,210
-
-
240
-
Securities at amortised cost
19,371
19,371
18,559
-
-
812
-
Due from banks at amortised cost
55,972
56,062
45,779
10,184
-
2,008
99
of which subordinated loans to credit institutions
99
99
-
-
-
-
99
Customer loans at amortised cost
497,164
498,733
468,028
8,830
21,874
8,396
-
Revaluation differences on portfolios hedged against interest rate risk
131
131
-
-
-
-
225
Investment of insurance activities
178,898
-
-
-
-
-
-
Tax assets
4,812
4,617
3,521
-
-
-
1,096
o.w deferred tax assets that rely on future profitability excluding those arising from temporary differences
1,719
1,096
-
-
-
-
1,096
o.w deferred tax assets arising from temporary differences
2,111
2,489
2,489
-
-
-
-
Other assets
92,898
90,357
62,781
-
-
3,562
24,015
o.w defined-benefit pension fund assets
85
85
0
-
-
85
Non-current assets held for sale
27
27
27
-
-
-
-
Investments accounted for using the equity method
95
4,649
4,649
-
-
-
-
Tangible and intangible assets
31,968
31,805
29,945
-
-
-
1,860
o.w intangible assets exclusive of leasing rights
2,733
2,599
739
-
-
-
1,860
Goodwill
3,741
3,416
-
-
-
-
3,416
TOTAL ASSETS
1,464,449
1,299,698
887,055
224,514
21,874
335,823
33,170
LIABILITIES at 31.12.2021
(In EURm)
Consolidated
balance sheet
(statutory
scope)
Consolidated
balance sheet
within the
prudential
scope
Subject to
credit risk
Subject to
counterparty
credit risk
Subject to the
securitisation
framework
Subject to
market risk
Not subject to
capital
requirements
or subject to
deduction
from capital
Due to central bank
5,152
5,152
-
-
-
-
5,152
Financial liabilities at fair value through profit or loss
307,563
309,418
-
192,282
-
301,699
7,719
Hedging derivatives
10,425
10,429
-
10,429
-
8
0
Debt securities issued
135,324
135,757
-
-
-
35,879
99,878
Due to banks
139,177
136,652
-
996
-
995
135,656
Customer deposits
509,133
510,013
-
6,738
-
6,264
503,275
Revaluation differences on portfolios hedged against interest rate risk
2,832
2,832
-
-
-
-
2,832
Tax liabilities
1,577
1,279
-
-
-
-
1,279
Other Liabilities
106,305
97,536
-
-
-
1,371
96,165
Non-current liabilities held for sale
1
1
-
-
-
-
1
Liabilities related to insurance activities contracts
155,288
-
-
-
-
-
-
Provisions
4,850
4,827
-
-
96
4,731
Subordinated debts
15,959
15,999
-
-
-
-
15,999
of which redeemable subordinated notes including revaluation differences on hedging items
15,519
15,561
-
-
-
-
15,561
TOTAL DEBTS
1,393,586
1,229,894
-
210,444
-
346,311
872,688
Subtotal Equity, Group share
65,067
64,865
-
-
-
-
64,865
Issued common stocks, equity instruments and capital reserves
29,447
29,448
-
-
-
-
29,448
Retained earnings
30,631
30,428
-
-
-
-
30,428
Net income
5,641
5,641
-
-
-
-
5,641
Unrealised or deferred capital gains and losses
(652)
(653)
-
-
-
-
(653)
Minority interests
5,796
4,939
-
-
-
-
4,939
TOTAL EQUITY
70,863
69,804
-
-
-
-
69,804
TOTAL LIABILITIES
1,464,449
1,299,698
-
210,444
-
346,311
942,492
Some balance sheet items have been allocated to both “counterparty” and “market” risk categories: this is mostly the case for some derivative items at fair value through profit or loss as well as for reverse repos.
ASSETS at 31.12.2020
(In EURm)
Consolidated
balance sheet
(statutory
scope)
Consolidated
balance sheet
within the
prudential
scope
Subject to
credit risk
Subject to
counterparty
credit risk
Subject to the
securitisation
framework
Subject to
market risk
Not subject to
capital
requirements
or subject to
deduction
from capital
Cash, due from banks
168,179
168,179
165,837
-
-
-
2,342
Financial assets at fair value through profit or loss
411,916
422,882
22,490
263,990
-
400,392
-
Hedging derivatives
20,667
20,689
-
20,689
-
264
-
Financial assets at fair value through other comprehensive income
52,060
52,060
51,795
-
-
265
-
Securities at amortised cost
15,635
15,635
15,592
-
-
-
43
Due from banks at amortised cost
53,380
53,594
42,192
11,264
-
11,264
138
of which subordinated loans to credit institutions
97
97
-
-
-
-
97
Customer loans at amortised cost
448,761
450,299
422,242
8,439
18,966
8,323
652
Revaluation differences on portfolios hedged against interest rate risk
378
378
-
-
-
-
378
Investment of insurance activities
166,854
-
-
-
-
-
-
Tax assets
4,995
4,907
3,687
-
-
-
1,227
o.w deferred tax assets that rely on future profitability excluding those arising from temporary differences
1,840
1,227
0
-
-
-
1,227
o.w deferred tax assets arising from temporary differences
2,261
2,697
2,697
-
-
-
-
Other assets
67,341
64,862
42,971
-
-
345
21,546
o.w defined-benefit pension fund assets
52
52
-
-
-
-
52
Non-current assets held for sale
6
6
6
-
-
-
-
Investments accounted for using the equity method
100
4,692
4,692
-
-
-
-
Tangible and intangible assets
30,088
29,922
28,235
-
-
-
1,687
o.w intangible assets exclusive of leasing rights
2,485
2,345
658
-
-
-
1,687
Goodwill
4,044
3,719
-
-
-
-
3,719
TOTAL ASSETS
1,444,404
1,291,824
799,732
304,382
18,966
420,854
31,732
LIABILITIES at 31.12.2020
(In EURm)
Consolidated
balance sheet
(statutory
scope)
Consolidated
balance sheet
within the
prudential
scope
Subject to
credit risk
Subject to
counterparty
credit risk
Subject to the
securitisation
framework
Subject to
market risk
Not subject to
capital
requirements
or subject to
deduction
from capital
Due to central bank
1,489
1,489
-
-
-
-
1,489
Financial liabilities at fair value through profit or loss
372,705
374,736
-
263,392
-
320,981
53,755
Hedging derivatives
12,461
12,471
-
12,471
-
49
0
Debt securities issued
138,957
139,780
-
-
-
41,426
98,353
Due to banks
135,571
132,904
-
621
-
621
132,283
Customer deposits
456,059
457,439
-
5,536
-
5,536
451,903
Revaluation differences on portfolios hedged against interest rate risk
7,696
7,696
-
-
-
-
7,696
Tax liabilities
1,227
933
-
-
-
-
933
Other Liabilities
84,937
78,254
-
-
-
4,173
74,081
Non-current liabilities held for sale
-
-
-
-
-
-
-
Liabilities related to insurance activities contracts
146,126
-
-
-
-
-
-
Provisions
4,732
4,712
-
-
-
36
4,676
Subordinated debts
15,432
15,472
-
-
-
-
15,472
of which redeemable subordinated notes including revaluation differences on hedging items
15,001
15,041
-
-
-
-
15,041
TOTAL DEBTS
1,377,392
1,225,885
-
282,020
-
372,822
840,642
Subtotal Equity, Group share
61,710
61,508
Issued common stocks, equity instruments and capital reserves
31,628
31,628
-
-
-
-
31,628
Retained earnings
32,102
31,900
-
-
-
-
31,900
Net income
(258)
(258)
-
-
-
-
(258)
Unrealised or deferred capital gains and losses
(1,761)
(1,762)
-
-
-
-
(1,762)
Minority interests
5,302
4,431
-
-
-
-
4,431
TOTAL EQUITY
67,012
65,938
-
-
-
-
65,938
TOTAL LIABILITIES
1,444,404
1,291,824
-
282,020
-
372,822
906,580
(In EURm)
Consolidated
balance sheet
within the
prudential scope
Subject to
credit risk
Subject to
counterparty
credit risk
Subject to the
securitisation
framework
Subject to
market risk
Asset carrying value amount under the scope of regulatory consolidation
1,266,528
887,055
224,514
21,874
335,823
Liabilities carrying value amount under the scope of regulatory consolidation
(210,444)
-
(210,444)
-
(346,311)
TOTAL NET AMOUNT UNDER REGULATORY SCOPE OF CONSOLIDATION
1,056,083
887,055
14,069
21,874
(10,487)
Off-balance sheet amounts
267,890
243,882
-
24,008
Differences in valuations
(911)
-
-
-
Differences due to different netting rules
130,840
-
130,840
-
Differences due to considerations for provisions
7,014
7,014
-
-
Differences due to the use of Credit Risk Mitigation (CRM) techniques
(9,946)
(9,946)
-
-
Differences due to Credit Conversion Factors (CCF)
(132,555)
(132,555)
-
-
Differences due to securitisation with risk transfer
-
-
-
-
Other differences
(239,081)
(105,111)
-
(1,796)
EXPOSURE AMOUNTS CONSIDERED FOR REGULATORY PURPOSES (EAD)
1,079,334
890,339
144,909
44,086
The table above features the various effects inducing the difference between accounting carrying values on prudential perimeter and regulatory exposures (EAD), split by type of risk.
As per BCBS recommendations and EBA instructions, total accounting carrying values correspond to those displayed in table LI1 without elements not subject to capital requirements or subject to deduction from capital.
■inclusion of gross off-balance sheet amounts: financing and guarantee commitments relating to credit risk as well as securitisation exposures;
■reintegration of provisions associated with exposures treated under advanced approach, insofar as initial accounting carrying values are net of provisions while credit risk EAD in advanced approach is gross;
■impact on EAD treated under standardised approach of some Credit Risk Mitigation elements (cash collateral);
■other differences: notably include the deduction of items subject to market risk that do not generate EAD.
(In EURm)
Consolidated
balance sheet
within the
prudential scope
Subject to
credit risk
Subject to
counterparty
credit risk
Subject to the
securitisation
framework
Subject to
market risk
Asset carrying value amount under the scope of regulatory consolidation
1,260,092
799,732
304,382
18,966
420,854
Liabilities carrying value amount under the scope of regulatory consolidation
(282,020)
-
(282,020)
-
(372,822)
TOTAL NET AMOUNT UNDER REGULATORY SCOPE OF CONSOLIDATION
978,072
799,732
22,362
18,966
48,032
Off-balance sheet amounts
241,251
220,818
-
20,433
Differences in valuations
(884)
-
-
-
Differences due to different netting rules
104,133
-
104,133
-
Differences due to considerations for provisions
7,928
7,928
-
-
Differences due to the use of Credit Risk Mitigation (CRM) techniques
(8,469)
(8,469)
-
-
Differences due to Credit Conversion Factors (CCF)
(123,282)
(123,282)
-
-
Differences due to securitisation with risk transfer
-
-
-
-
Other differences
(194,902)
(57,196)
-
(1,578)
EXPOSURE AMOUNTS CONSIDERED FOR REGULATORY PURPOSES (EAD)
1,003,847
839,531
126,495
37,821
31.12.2021
(In EURm)
Risk category
Category level AVA –
Valuation uncertainty
Total category level post-
diversification
Category level AVA
Equity
Interest Rates
Foreign exchange
Credit
Commodities
Unearned
credit
spreads
AVAInvestment
and
funding
costs AVAof which
Total core
approach
in the
trading
bookof which
Total core
approach
in the
banking
bookMarket price uncertainty
293
122
7
51
-
-
17
245
232
13
Close-out cost
89
114
3
24
-
0
12
121
102
19
Concentrated positions
226
75
5
7
-
313
260
53
Early termination
-
-
-
-
-
-
-
-
Model risk
186
25
-
7
-
139
-
178
138
40
Operational risk
-
0
-
-
-
0
-
0
Future administrative costs
53
-
-
-
-
53
53
0
TOTAL ADDITIONAL VALUATION ADJUSTMENTS (AVAS)
911
785
125
-
6 CREDIT RISK
Credit risk corresponds to the risk of losses arising from the inability of the Group’s customers, issuers or other counterparties to meet their financial commitments. This risk includes the risk linked to securitisation activities and may be further amplified by individual, country and sector concentration risk.
Credit risk RWA at end 2021
EUR 277.4bn
(Credit risk RWA at end 2020: EUR 260.9bn)
EAD calculated in IRB
(% of total credit risk):
83%
Credit risk corresponds to the risk of losses arising from the inability of the Group’s customers, issuers or other counterparties to meet their financial commitments. This risk includes the risk related to securitisation activities, and may be further amplified by individual, country and sector concentration risk.
-
6.1 CREDIT RISK MONITORING AND SURVEILLANCE SYSTEM
■the analysis and the validation of the files fall respectively and independently to the sector of commercial follow-up of the client and to the dedicated risk units within the risk management function. In order to guarantee a consistent approach to Group risk-taking, this commercial monitoring sector and this risk unit examine all authorisation requests relating to a given client or category of clients. This commercial monitoring sector and this risk unit must be independent of each other;
■the internal rating of counterparties is a key criterion in the granting policy. These ratings are proposed by the commercial monitoring sector and validated by the dedicated risk unit;
■a system of delegation of competence, largely based on the internal rating of the counterparties, confers decision-making capacities to the risk units on the one hand and the commercial monitoring sectors on the other.
The business line assumes the burden of provisions and losses related to its credit decisions as the first line of defence. The Risk Department submits recommendations to CORISQ on the evolution of the granting policy, with limits on credit portfolios, for the countries, geographic areas, sectors, products or types of customers presenting high concentration risks.
The Risk Department, working with the Finance Division, determines the risk appetite of the Group. This seeks to define the acceptable level of risk given the Group’s strategic aims.
The Risk Department is responsible for implementing the system to manage and monitor risks, including cross-Group risks. The Risk Division exercises hierarchical and functional oversight of the Risk management function in charge of Group credit risk giving it a comprehensive view of all the Group’s credit risks.
The Risk Department helps define risk policies in light of each core business targets and the associated risk issues. It defines or approves the methods and procedures used to analyse, measure, approve and monitor risks and the risk IT system and makes sure these are appropriate to the core businesses’ needs. As second line of defence, various Risk Departments (for Retail Banking, Corporate and Investment Banking and Market activities) are also in charge of credit risk and as such responsible for the independent control as second line of defence. These consist in independently reviewing and comparing any credit application that exceeds the authority delegated to core businesses or local Risk Department teams. The Risk Department also assesses the quality of first-level credit reviews and takes any corrective action necessary.
The Risk Department also approves transactions and limits proposed by core business lines in respect of credit risk.
Finally, as part of its responsibilities for second line of defence, the Risk Department carries out permanent controls of credit risks. As such, the Risk Department provides independent control as a second line of defence on the detection and monitoring of the resolution of limit overruns.
The monthly Risk Monitoring Report presented to CORISQ by the Risk Department comments among others on the evolution of the Group’s credit portfolio and ensures compliance with the guidelines. Changes in the credit portfolio, changes in credit policy validated by CORISQ and respect for the Group’s risk appetite are presented at least quarterly to the Risk Committee of the Board of Directors.
As part of the quarterly reporting to the Board of Directors and to the Risk Committee of the Board of Directors, an overview of the main credit risk metrics supplemented by details of the thresholds and limits where applicable is presented. The following metrics are in particular the subject of a presentation with a quarterly history: net cost of risk, NPL rate (non-performing loans), coverage rate, average credit quality of portfolios, outstanding corporates placed under surveillance (watchlist), supervision of corporate exposures by sector of activity, Grands Risques Réglementaires (major regulatory risk exposures), etc.
A monthly version of the reporting intended for the Risk Committee of the Board of Directors also provides additional information at a Business Unit level or on certain financing activities. A summary of the thematic CORISQs is also presented.
As part of the monthly CORISQ reporting to General Management, a summary of the main credit files is presented. Thematic presentations also provide recurring clarifications on certain perimeters and activities: personal real estate loans, consumer credit, non-retail credit risk, sector limits, country risks, major regulatory risks (Grands Risques Réglementaires), etc.
Individual and professional portfolio (retail portfolio) have specific features in terms of risk management. This management is based on a statistical approach and on the use of tools and methods in the industrialisation of processes.
The retail portfolio is made up of a sum of exposures of low unit amounts, validated in a partially automated manner, which together constitute significant outstandings at Group level and therefore a high level of risk.
Given the high number and standardisation of retail clients commitments, aggregate monitoring is necessary at all levels of the Risk function in charge of credit risk. This mass monitoring of retail customer exposure is based on the use of a statistical risk approach and monitoring by homogeneous risk class.
In these circumstances, the risk monitoring system for the Retail portfolio cannot rely on the same procedures or the same tools as for corporates.
For instance, any change in marketing policy (cut to probationary period for loyalty, delegation of lending decisions to brokers, increase in margins, etc.) can have a rapid and massive impact and must therefore be tracked by a system that allows all actors (i) to identify as quickly as possible where any deterioration in exposures is coming from and (ii) to take remedial action.
Even if the IFRS 9 standard authorizes a collective approach and if the Group has a statistical approach on retail customers for the evaluation of the expected loss, the increase in risk for the purposes of the classification into stages is identified on an individual basis for this clientele. The available parameters (operating accounts and late payments) allow the assessment of the significant increase in credit risk at the level of individual exposures. The collective approach is currently only used in a very small number of instances within the Group.
The Risk management function must support Business Units and subsidiary managers in managing their risks with an eye to:
■the quality of the portfolio and its development over the lifetime of exposures (from grant to recovery).
■granting: this decision-making process can be more or less automated depending on the nature and complexity of the transactions, and hence the associated risk;
■monitoring: different entities use different systems for granting and managing retail risks systems (scoring, expert systems, rules, etc.) and an appropriate monitoring system must be in place for each to assess the appropriateness of the grant rules applied (notably via monitoring);
■recovery: recovery is an essential stage in the life cycle of Retail portfolio credits and makes a decisive contribution to our control of cost of risk. Whatever the organisation adopted (outsourcing, in-house collection, etc.), the establishment of an effective collection process is an essential element of good risk management. It makes a decisive contribution to controlling the cost of risk and limiting the level of our non-performing loans. If recovery is outsourced, it must conform to the Group’s regulations governing outsourcing;
■provisioning: provisions against the Retail portfolio are decided at local level. They are calculated using the methodologies and governance methods defined and approved by the Risk Department.
Societe Generale complies with regulations governing large exposures (major regulatory risks exposure cap of 25% of equity). A more restrictive internal limit of 10% delegated by General Management (which can occasionally or permanently amend it) has been put in place. Since 1st July 2018, the High Council for Financial Stability has imposed to financial institutions an exposure limit on most indebted companies established in France at a maximum level of 5% of eligible equity.
Internal systems are implemented to identify and manage the risks of individual concentrations, particularly at granting of credit. For example, concentration thresholds, based on the internal rating of counterparties, are set by CORISQ and define the governance for validating the limits on individual concentrations. Exposures to groups of clients deemed significant by the Group are reviewed by the Large Exposure Committee chaired by the General Management. As part of the identification of its risks, the Group also carries out loss simulations by type of customer (on significant individual exposures that the Group could have).
The Group uses credit derivatives to reduce some exposures considered to be overly significant. Furthermore, the Group systematically seeks to mutualize risks with other banking partners by avoiding keeping an excessive share in the banking pool of large-scale companies.
Country risk arises when an exposure (loan, security, guarantee or derivative) becomes susceptible to negative impact from changing regulatory, political, economic, social and financial conditions.
■political and non-transfer risk covers the risk of non-payment resulting from either actions or measures taken by local government authorities (decision to prohibit the debtor from meeting its commitments, nationalisation, expropriation, non-convertibility, etc.), domestic events (riots, civil war, etc.) or external events (war, terrorism, etc.);
■commercial risk occurs when the credit quality of all counterparties in a given country deteriorates due to a national economic or financial crisis, independently of each counterparty’s individual financial situation. This could be a macroeconomic shock (sharp slowdown in activity, systemic banking crisis, etc.), currency depreciation, or sovereign default on external debt potentially entailing other defaults.
Overall limits and/or monitoring of exposures have been established for countries based on their internal ratings and governance indicators. The supervision is strengthened depending on the level of the country’s risk.
Country limits are approved annually by Risk Department (or General Management in specific situations). They can be revised downward at any time if the country’s situation deteriorates or is expected to deteriorate.
All Group exposures (securities, derivatives, loans and guarantees) are taken into account by this monitoring. The Country Risk methodology determines an initial risk country and a final risk country (after any guarantee-related effects), which is supervised using country limits.
The procedure for putting a country on watch list is triggered in the event of deterioration in the country risk or anticipation of such a deterioration by the Risk Department.
The Group regularly reviews its entire credit portfolio through analyses by business sector. To do this, it relies on industry sector studies (including a one-year anticipation of sectoral risk) and on sectoral concentration analyses.
In addition, the Group periodically reviews its exposures to the portfolio segments presenting a specific risk profile, within the framework of CORISQs at Group level or at Business Unit level. These identified sectors or sub-portfolios are, where appropriate, subject to specific supervision through portfolio exposure limits and specific granting criteria. The limits are monitored either at General Management level or at Business Unit Management level depending on the materiality and the level of risk of the portfolios.
As a complement, more targeted sector-based research and business portfolio analysis, may be conducted by General Management, the Risk Department or Bank Departments, depending on current issues. In that respect, Covid-19 vulnerable sectors have been subject to specific monitorings.
■individual and professional credit portfolio (retail) in metropolitan France on the first hand and in International Retail Banking in Europe on the other hand. The Group defines in particular a risk appetite target concerning the minimum share covered by Credit Logement guarantee for real estate loans granted to individuals;
■oil and gas sectors, on which the Group has defined a credit policy adapted to the different types of activity of sector players. This policy distinguishes financing guaranteed by oil reserves, project financing, short-term trade finance transactions, and takes into account regional characteristics;
■commercial real estate scope, on which the Group has defined a framework for origination and monitoring of exposures and limits according to the different types of financing, geographical areas and/or activities;
■leveraged finance, for which the Group applies the definition of the scope and the management guidelines recommended by the ECB in 2017 (Guidance on leveraged transactions). The Group continues to pay a particular attention to the Leverage Buy-Out (LBO) sub-portfolio;
■exposures on hedge funds is subject to a specific attention. The Group incurs risk on hedge funds through derivative transactions and its financing activity guaranteed by shares in funds. Risks related to hedge funds are governed by individual limits and global limits on market risks and wrong way risks;
■exposures on shadow banking are managed and monitored in accordance with the EBA guidelines published in 2015 which specifies expectations regarding the internal framework for identifying, controlling and managing identified risks. CORISQ has set a global exposure threshold for shadow banking.
With the aim of identifying, monitoring and managing credit risk, the Risk Department works with the businesses to conduct a set of specific stress tests relating to a country, subsidiary or activity. These specific stress tests combine both recurring stress tests, conducted on those portfolios identified as structurally carrying risk, and ad hoc stress tests, designed to recognise emerging risks. Some of these stress tests are presented to CORISQ and used to determine how to frame the corresponding the activities concerned.
Credit risk stress tests complement the global analysis with a more granular approach and allow fine-tuning of the identification, assessment and operational management of risk, including concentration. They allow to calculate the expected credit losses on exposures which have undergone an event of default and on exposures which have not undergone an event of default, in accordance with the method prescribed in the standard IFRS 9. The perimeter covered may include counterparty credit risk on market activities when relevant.
-
6.2 CREDIT RISK HEDGING
The Group uses credit risk mitigation techniques for both market and commercial banking activities. These techniques provide partial or full protection against the risk of debtor insolvency.
■personal guarantees are commitments made by a third party to replace the primary debtor in the event of the latter’s default. These guarantees encompass the protection commitments and mechanisms provided by banks and similar credit institutions, specialised institutions such as mortgage guarantors, monoline or multiline insurers, export credit agencies, States in the context of the health crisis linked to Covid-19, etc. By extension, credit insurance and credit derivatives (purchase of protection) also belong to this category;
■collateral can consist of physical assets in the form of property, commodities or precious metals, as well as financial instruments such as cash, high-quality investments and securities, and also insurance policies.
In order to reduce its risk-taking, the Group is pursuing active management of its securities, in particular by diversifying them: physical collateral, personal guarantees and others (including Credit Default Swaps).
For information, the mortgage loans of retail customers in France benefit overwhelmingly from a guarantee provided by the financing company Crédit Logement, ensuring the payment of the mortgage to the Bank in the event of default by the borrower (under conditions of compliance with the terms of collateral call defined by Crédit Logement).
During the credit approval process, an assessment is performed on the value of guarantees and collateral, their legal enforceability and the guarantor’s ability to meet its obligations. This process also ensures that the collateral or guarantee successfully meets the criteria set forth in the Capital Requirements Directive (CRD).
The guarantors are subject to an internal rating updated at least annually. Regarding collateral, regular revaluations are made on the basis of an estimated disposal value composed of the market value of the asset and a discount. The market value corresponds to the value at which the good should be exchanged on the date of the valuation under conditions of normal competition. It is preferably obtained on the basis of comparable assets, failing this by any other method deemed relevant (example: value in use). This value is subject to haircuts depending on the quality of the collateral and the liquidity conditions.
Regarding collateral used for credit risk mitigation and eligible for the RWA calculation, it should be noted that 95% of guarantors are investment grade. These guarantees are mainly provided by Crédit Logement, export credit agencies, the French State (within the Prêts Garantis par l’État framework of the loans guaranteed by the French State) and insurance companies.
In accordance with the requirements of European Regulation No. 575/2013 (CRR), the Group applies minimum collateralisation frequencies for all collateral held in the context of commitments granted (financial collateral, commercial real estate, residential real estate, other security interests, leasing guarantees).
Closer valuations must be carried out in the event of a significant change in the market concerned, the default or litigation of the counterparty or at the request of the risk management function.
It is the responsibility of the risk management function to validate the operational procedures put in place by the business lines for the periodic valuation of collateral (guarantees and collateral), whether automatic valuations or on an expert opinion and whether during the credit decision for a new competition or during the annual renewal of the credit file.
The amount of guarantees and collateral is capped at the amount of outstanding loans less provisions, i.e. EUR 373 billion as at 31 December 2021 (compared with EUR 319 billion as at 31 December 2020), of which EUR 175 billion for retail customers and EUR 198 billion for other types of counterparties (compared with EUR 156 billion and EUR 163 billion as at 31 December 2020, respectively).
The outstanding loans covered by these guarantees and collateral correspond mainly to loans and receivables at mortised cost, which amounted to EUR 294 billion as at 31 December 2021, and to off-balance sheet commitments, which amounted to EUR 68 billion (compared with EUR 258 billion and EUR 51 billion as at 31 December 2020 respectively).
The amounts of guarantees and collateral received for performing outstanding loans (Stage 1) and under-performing loans (Stage 2) with payments past due amounted to EUR 2.4 billion as at 31 December 2021 (EUR 4.3 billion as at 31 December 2020), including EUR 1.5 billion on retail customers and EUR 0.9 billion on other types of counterparties (versus EUR 1.7 billion and EUR 2.6 billion as at 31 December 2020 respectively).
The amount of guarantees and collateral received for non-performing outstanding loans as at 31 December 2021 amounted to EUR 5.2 billion (compared with EUR 4.5 billion as at 31 December 2020), of which EUR 1.8 billion on retail customers and EUR 3.4 billion on other types of counterparties (compared with EUR 1.8 billion and EUR 2.7 billion respectively as at 31 December 2020). These amounts are capped at the amount of outstanding.
The Group may use credit derivatives for in the management of its Corporate credit portfolio, primarily to reduce individual, sector and geographic concentrations and to implement a proactive risk and capital management approach.
Housed in Corporate and Investment Banking, the Performance & Scarce Resources management (PSR) team works in close conjunction with the Risk Department and the businesses to reduce excessive portfolio concentrations, react quickly to any deterioration in the creditworthiness of a particular counterparty and recommend actions to improve the capital allocation. PSR is part of the department responsible for defining and effectively deploying the strategy, for monitoring performance and managing the scarce resources in the credit and loan portfolio.
Total outstanding purchases of protection through Corporate credit derivatives were stable at EUR 2.5 billion in nominal terms and a corresponding fair value of EUR -10.3 million at the end of December 2021 (compared to EUR 2.5 billion nominal value and a corresponding fair value of -7.3 million euros at the end of December 2020). New operations have mainly been performed to approve capital allocation (EUR 1.7 billion) and to a lower extend reduce concentration risk (EUR 0.8 billion).
Over 2021, the credit default swaps (CDS) spreads of European investment grade issues (Itraxx index) were stable, fluctuating around an annual average of 50bps. The overall sensitivity of the portfolio (Price Value of a Basis Point) is falling due to the reduction in the average maturity of the protections.
The majority of protection purchases (99% of outstandings as of 31 December 2021) are made against European clearing houses, and all against counterparties with “Investment Grade” ratings (rating at least equal to BBB-).
Moreover, the amounts recognised as assets (EUR 0.9 billion as at 31 December 2021 versus EUR 1.3 billion as at 31 December 2020) and liabilities (EUR 1.2 billion as at 31 December 2021 versus EUR 1.4 billion as at 31 December 2020) correspond to the fair value of credit derivatives mainly held under a transaction activity.
As part of LCR stress tests, Article 30(2) of Delegated Act 2015/61 provides for a specific additional flow associated with a three-notch downgrade of the bank’s rating. In this regard, the impact in terms of additional cash collateral in case of a three-notch downgrade of the Group’s rating is estimated at EUR 2 billion as at 31 December 2021.
The Group has been developing relationships with private insurers over the last several years in order to hedge some of its loans against commercial and political non-payment risks.
This activity is performed within a risk framework and monitoring system approved by the Group’s General Management. The system is based on an overall limit for the activity, along with sub-limits by maturity, and individual limits for each insurance counterparty, the latter being furthermore required to meet strict eligibility criteria. There is also a limit for insured transactions in Non-Investment Grade countries.
-
6.4 RISK MEASUREMENT AND INTERNAL RATINGS
Since 2007, Societe Generale has been authorised by its supervisory authorities to apply, for the majority of its exposures, the internal method (IRB method, Internal Rating Based) to calculate the capital required for credit risk.
The remaining exposures subject to the Standard approach mainly concern the portfolios of retail customers and SMEs (Small and Medium Enterprises) of the International Retail Banking activities. For exposures processed under the standard method excluding retail banking, the Group mainly uses external ratings from the Standard & Poor’s, Moody’s and Fitch rating agencies and the Banque de France. In the event that several Ratings are available for a third party, the second best Rating is retained.
The rating model monitoring framework is operational, in accordance with regulatory requirements, and detailed in section 4.5.4 “Risk measurement and internal ratings” of the 2022 Universal Registration Document.
In accordance with the texts published by the EBA as part of the “IRB Repair” program and following the review missions carried out by the ECB (TRIM – Targeted Review of Internal Models), the Group plans to develop its internal model system credit risk, so as to comply with these new requirements. A program (“Haussmann”) has been launched in this direction within the Group, and deals with aspects such as:
■the simplification of the architecture of the models, and the improvement of its auditability: either by ex nihilo development of new models based on the New Definition of Default (NDoD), and natively integrating the expectations of the EBA and ECB, or by bringing certain existing models up to standard ;
■the review of the roles and responsibilities of the teams, particularly with regard to the construction and monitoring (“backtest”) of the system ;
■the establishment of a more complete normative base, and a more consistent relationship with the supervisor.
The program is also based on building the target model strategy on the roll-out plan towards the IRB approach.
Following the TRIMs and as part of compliance with IRB Repair, evolutions to the rating systems and models have been and will be submitted for validation to the ECB.
To calculate its capital requirements under the IRB method, Societe Generale estimates the Risk-Weighted Assets (RWA) and the Expected Loss (EL) that may be incurred in light of the nature of the transaction, the quality of the counterparty (via internal rating) and all measures taken to mitigate risk.
The calculation of RWA is based on the parameters Basel parameters, which are estimated using the internal risk measurement system:
■the Exposure at Default (EAD) value is defined as the Group’s exposure in the event that the counterparty should default. The EAD includes exposures recorded on the balance sheet (loans, receivables, accrued income, market transactions, etc.), and a proportion of off-balance sheet exposures calculated using internal or regulatory Credit Conversion Factors (CCF) ;
■the Probability of Default (PD): the probability that a counterparty of the Bank will default within one year ;
■the Loss Given Default (LGD): the ratio between the loss incurred on an exposure in the event a counterparty defaults and the amount of the exposure at the time of the default.
The estimation of these parameters is based on a quantitative evaluation system which is sometimes supplemented by expert or business judgment.
In addition, a set of procedures sets out the rules relating to ratings (scope, frequency of review, grade approval procedure, etc.) as well as those for supervision, backtesting and the validation of models. These procedures allow, among other things, to facilitate critical human judgment, an essential complement to the models for non-retail portfolios.
■the impact of guarantees and credit derivatives, by substituting the PD, the LGD and the risk-weighting calculation of the guarantor for that of the obligor (the exposure is considered to be a direct exposure to the guarantor) in the event that the guarantor’s risk weighting is more favorable than that of the obligor ;
■collateral used as guarantees (physical or financial). This impact is taken into account via the LGD level.
To a very limited extent, Societe Generale also applies an IRB Foundation approach (where only the probability of default is estimated by the Bank, while the LGD and CCF parameters are determined directly by the supervisory authority) to a portfolio of specialized lending exposures, including those granted to the subsidiaries Franfinance Entreprises, Sogelease and Star Lease.
Moreover, the Group has authorisation from the regulator to use the IAA (internal assessment approach) method to calculate the regulatory capital requirement for ABCP (Asset-Backed Commercial Paper) securitisation.
In addition to the capital requirement calculation objectives under the IRBA method, the Group’s credit risk measurement models contribute to the management of the Group’s operational activities. They also constitute tools to structure, price and approve transactions and contribute to the setting of approval limits granted to business lines and the Risk function.
Should an external rating be available, the corresponding exposure is assigned a risk weight according to the mapping tables provided in CRR (Articles 120-121-122) or more precisely to the tables published by the French supervisor ACPR (link: https://acpr.banque-france.fr/sites/default/files/media/2021/07/08/20210707_notice_crdiv_college_clean.pdf).
(In EURm)
31.12.2021
Exposure
value as
defined in
Article 166
CRR for
exposures
subject to
IRB
approach
Total
exposure
value for
exposures
subject to
the
Standardised
approach
and to the
IRB
approach
Percentage
of total
exposure
value
subject to
the
permanent
partial use
of the SA
(%)
Percentage
of total
exposure
value
subject to a
roll-out plan
(%)
Percentage
of total
exposure
value
subject to
IRB
approach
(%)
of which
percentage
subject to
AIRB
approach
(%)
Central governments or central banks
243,502
253,240
3.43%
-
96.57%
96.56%
of which Regional governments or local authorities
1,833
7.33%
-
92.67%
92.67%
of which Public sector entities
111
92.65%
-
7.35%
7.35%
Institutions
40,410
46,806
9.63%
0.01%
90.36%
90.36%
Corporates
266,895
312,786
9.37%
1.94%
88.69%
86.86%
of which Corporates - Specialised lending, excluding slotting approach
62,706
1.63%
-
98.37%
98.37%
of which Corporates - Specialised lending under slotting approach
1,436
-
-
100.00%
100.00%
Retail
177,266
244,359
19.22%
8.77%
72.01%
72.01%
of which Retail – Secured by real estate SMEs
6,504
12.33%
0.59%
87.08%
87.08%
of which Retail – Secured by real estate non-SMEs
141,329
11.17%
11.55%
77.28%
77.28%
of which Retail – Qualifying revolving
6,001
32.18%
9.38%
58.44%
58.44%
of which Retail – Other SMEs
36,052
33.29%
1.45%
65.26%
65.26%
of which Retail – Other non-SMEs
54,473
30.21%
7.30%
62.49%
62.49%
Equity
6,203
7,410
16.29%
-
83.71%
83.71%
Other non-credit obligation assets
868
37,883
97.71%
-
2.29%
2.29%
TOTAL
735,144
902,485
14.15%
3.05%
82.80%
82.17%
IRB approach
Standard approach
French Retail Banking
Majority of French Retail Banking and Credit du Nord and Private Banking portfolios
Some specific client or product types for which the modeling is currently not adapted Boursorama
International Retail Banking and Financial Services
Subsidiaries KB (Czech Republic), CGI, Fiditalia, GEFA, SG Leasing SPA and Fraer Leasing SPA, SGEF Italy
Other international subsidiaries (in particular BRD, SG Maroc, Rosbank)
Global Banking and Investor Solutions
Majority of Corporate and Investment Banking portfolios
SG Kleinwort Hambros and SGIL subsidiaries, as well as specific client or product types for which the modeling is currently not adapted
For Corporate (including specialized financing), Banking and Sovereign portfolios, the Group has implemented the following system.
The rating system consists in assigning a rating to each counterparty according to an internal scale, for which each grade corresponds to a probability of default determined using historical series observed by Standard & Poor’s for over more than twenty years.
The following table presents the indicative corresponding scales of the main external credit assessment institutions and the corresponding average probabilities of default, as well as the Group’s internal rating scale.
The rating assigned to a counterparty is generally proposed by a model, and possibly adjusted by a credit analyst, who then submits it for validation by the Risk Management.
The counterparty rating models are structured in particular according to the type of counterparty (companies, financial institutions, public entities, etc.), geographic region and size of the Company (usually assessed through its annual revenue).
The Company rating models are underpinned by statistical models (regression methods) of client default. They combine quantitative parameters derived from financial data that evaluate the sustainability and solvency of companies and qualitative parameters that evaluate economic and strategic dimensions.
Investment grade/
Non-investment grade
Probability of
default range
Counterparty
internal rating
Indicative
equivalent
Standard &
Poor’s
Indicative
equivalent
Fitch
Indicative
equivalent
Moody’s
1-year internal
probality of
default
(average)
Investment grade
0.00 to <0.10
1
AAA
AAA
Aaa
0,009%
2+
AA+
AA+
Aa1
0,014%
2
AA
AA
Aa2
0,020%
2-
AA-
AA-
Aa3
0,026%
3+
A+
A+
A1
0,032%
3
A
A
A2
0,036%
3-
A-
A-
A3
0,061%
0.10 to <0.15
4+
BBB+
BBB+
Baa1
0,130%
0.15 to <0.25
0.25 to <0.50
4
BBB
BBB
Baa2
0,257%
0.50 to <0.75
4-
BBB-
BBB-
Baa3
0,501%
Non-investment grade
0.75 to <1.75
5+
BB+
BB+
Ba1
1,100%
1.75 to <2.5
5
BB
BB
Ba2
2,125%
2.5 to <5
5-
BB-
BB-
Ba3
3,260%
6+
B+
B+
B1
4,612%
5 to <10
6
B
B
B2
7,761%
10 to <20
6-
B-
B-
B3
11,420%
7+
CCC+
CCC+
Caa1
14,328%
20 to <30
7
CCC
CCC
Caa2
20,441%
7-
C/CC/CCC-
CCC-
Caa3
27,247%
30 to <100
The Loss Given Default (LGD) is an economic loss that is measured by taking into account all parameters pertaining to the transaction, as well as the fees incurred for recovering the receivable in the event of a counterparty default.
The models used to estimate the Loss Given Default (LGD) excluding retail clients are applied by regulatory sub-portfolios, type of asset, size and location of the transaction or of the counterparty, depending on whether or not collateral has been posted, and the nature thereof if applicable. This makes it possible to define homogeneous risk pools, particularly in terms of recovery, procedures and the legal environment.
These estimates are founded on statistics when the number of loans in default is sufficient. In such circumstances, they are based on recovery data observed over a long period. When the number of defaults is insufficient, the estimate is revised or determined by an expert.
For its off-balance sheet exposures, the Group is authorized to use the internal approach for “Term loan with drawing period” products and revolving credit lines.
Parameter
modeled
Portfolio/
Category of
Basel assets
Number of methods, models
Methodology
Number of years default/loss
WHOLESALE CLIENTS
Sovereigns
1 method.
Econometric method. Low default portfolio.
Public sector
entities4 models according to geographic region.
Statistical (regression)/expert methods for the rating process, based on the combination of financial ratios and a qualitative questionnaire. Low default portfolio.
Probability
of Default (PD)Financial
institutions11 models according to type of counterparty: banks, insurance, funds, financial intermediaries, funds of funds.
Expert models based on a qualitative questionnaire. Low default portfolio.
Specialized financing
3 models according to type of transaction.
Expert models based on a qualitative questionnaire. Low default portfolio.
Large corporates
9 models according to geographic region.
Mainly statistical models (regression) for the rating process, based on the combination of financial ratios and a qualitative questionnaire. Defaults observed over a period of 8 to 10 years.
Small- and medium-sized companies
20 models according to the size of the Company and the geographic region.
Mainly statistical models (regression) for the rating process, based on the combination of financial ratios and a qualitative questionnaire, behavioral score. Defaults observed over a period of 8 to 10 years.
Public sector entities – Sovereigns
6 models according to type of counterparty.
Calibration based on historical data and expert judgments. Losses observed over a period of more than 10 years.
Large corporates – Flat-rate Approach
25 models Flat-rate approach according to type of collateral.
Calibration based on historical data adjusted by expert judgments. Losses observed over a period of more than 10 years.
Large corporates – Discount Approach
16 models Discount approach according to type of recoverable collateral.
Statistical calibration based on historical market data adjusted by expert judgments. Losses observed over a period of more than 10 years.
Loss Given
Default (LGD)Small- and medium-sized companies
16 models Flat-rate approach according to type of collateral or unsecured.
Statistical calibration based on historical data adjusted by expert judgments. Losses observed over a period of more than 10 years.
Project financing
9 models Flat-rate approach according to project type.
Statistical calibration based on historical data adjusted by expert judgments. Losses observed over a period of more than 10 years.
Financial institutions
5 models Flat-rate approach according to type of counterparty: banks, insurance, funds, etc. and the nature of the collateral.
Statistical calibration based on historical data adjusted by expert judgments. Losses observed over a period of more than 10 years.
Other specific portfolios
6 models: factoring, leasing with option to purchase and other specific cases.
Statistical calibration based on historical data adjusted by expert judgments. Losses observed over a period of more than 10 years.
Credit Conversion Factor (CCF)
Large corporates
5 models: term loans with drawing period, revolving credits, Czech Corporates.
Models calibrated by segment. Defaults observed over a period of more than 10 years.
Expected
Loss (EL)Real estate transactions
2 models by slotting.
Statistical model based on expert judgments and a qualitative questionnaire. Low default portfolio.
The performance level of the entire wholesale client credit system is measured by backtests that compare, by portfolio, the PD, LGD and CCF estimates with actual results, thus making it possible to measure the prudence of the risk parameters used by the IRB approach.
The backtest results and remediation plans are presented to the Expert Committee for discussion and approval (see section “Governance of the modelling of credit risk”). These results may justify the implementation of remediation plans if the system is deemed to be insufficiently prudent. The discriminating power of the models and the evolution of the composition of the portfolio are also measured.
The results presented above cover the entire Group portfolios. Backtests compare the estimated probability of default (arithmetic mean weighted by debtors) with the observed results (the historical annual default rate). The historical default rate was calculated on the basis of performing exposures over the period from 2008 to 2020.
The historic default rate remains stable across all the exposure classes. The estimated probability of default is higher than the historical default rates for all Basel portfolios and for most of the ratings. It should be noted that new internal models are being developed to comply with new regulatory requirements.
The Group has implemented the following system for the retail portfolio made up of individual customers, SCIs (real estate investment companies – Sociétés civiles immobilières) and professional customers:
The modeling of the probability of default of retail client counterparties is carried out specifically by each of the Group’s business lines recording its exposures using the IRBA method. The models incorporate data on the account behavior of counterparties. They are segmented by type of customer and distinguish between retail customers, professional customers, very small businesses and real estate investment companies (Sociétés civiles immobilières).
The counterparties of each segment are classified automatically, using statistical models, into homogeneous risk pools, each of which is assigned a probability of default. These estimates are adjusted by a safety margin to estimate as best as possible a complete default cycle, using a through-the-cycle (TTC) approach.
The models for estimating the Loss Given Default (LGD) of retail customers are specifically applied by business line portfolio and by product, according to the existence or not of collateral.
Consistent with operational recovery processes, estimate methods are generally based on a two-step modeling process that initially estimates the proportion of defaulted loans in loan termination, followed by the loss incurred in case of loan termination.
The expected losses are estimated using internal long-term historical recovery data for exposures that have defaulted. These estimates are adjusted by safety margins in order to reflect the possible impact of a downturn.
For its off-balance sheet exposures, Societe Generale applies its estimates for revolving loans and overdrafts on current accounts held by retail and professional customers.
Parameter
modeled
Portfolio/
Category of
Basel assets
Number of models
Methodology
Number of years of default/loss
RETAIL CLIENTS
Residential real estate
8 models according to entity, type of guarantee (security, mortgage), type of counterparty: individuals or professionals/VSB, real estate investment company (SCI).
Statistical model (regression), behavioral score. Defaults observed over a period of more than 5 years.
Probability
of Default (PD)Other loans to individual customers
15 models according to entity and to the nature and object of the loan: personal loan, consumer loan, car loan, etc.
Statistical model (regression), behavioral score. Defaults observed over a period of more than 5 years.
Renewable exposures
5 models according to entity and nature of the loan: overdraft on current account, revolving credit or consumer loan.
Statistical model (regression), behavioral score. Defaults observed over a period of more than 5 years.
Professionals and very small businesses (VSB)
10 models according to entity, nature of the loan (medium- and long-term investment credits, short-term credit, car loans), and type of counterparty (individual or real estate investment company (SCI)).
Statistical model (regression or segmentation), behavioral score. Defaults observed over a period of more than 5 years.
Residential real estate
9 models according to entity, type of guarantee (security, mortgage), and type of counterparty: individuals or professionals/VSB, real estate investment company (SCI).
Statistical model of expected recoverable flows based on the current flows. Model adjusted by expert opinions if necessary. Losses and recoverable flows observed over a period of more than 10 years.
Loss Given
Default (LGD)Other loans to individual customers
18 models according to entity and to the nature and object of the loan: personal loan, consumer loan, car loan, etc.
Statistical model of expected recoverable flows based on the current flows. Model adjusted by expert opinions if necessary. Losses and recoverable flows observed over a period of more than 10 years.
Renewable exposures
7 models according to entity and nature of the loan: overdraft on current account, revolving credit or consumer loan.
Statistical model of expected recoverable flows based on the current flows. Model adjusted by expert opinions if necessary. Losses and recoverable flows observed over a period
of more than 10 years.Professionals and very small businesses
12 models according to entity, nature of the loan (medium- and long-term investment credits, short-term credit, car loans), and type of counterparty (individual or real estate investment company (SCI)).
Statistical model of expected recoverable flows based on the current flows. Model adjusted by expert opinions if necessary. Losses and recoverable flows observed over a period of more than 10 years.
Credit Conversion Factor (CCF)
Renewable exposures
12 calibrations by entity for revolving products and personal overdrafts.
Models calibrated by segment over a period of observation of defaults of more than 5 years.
The level of performance of the entire retail customer credit system is measured by backtests, which check the performance of PD, LGD and CCF models and compare estimates with actual results.
Each year, the average long-term default rates observed by homogeneous risk class are compared to the PDs.
The results presented below cover all of the Group’s portfolios. Backtests compare the estimated probability of default (arithmetic average weighted by the debtors) to the observed results (the historical annual default rate). The historical default rate was calculated on the basis of healthy outstandings over the period from 2010 to 2020. Creditors are included in accordance with the revised instructions of the EBA publication of December 14, 2016 (EBA/GL/2016/11).
The historical default rate is relatively stable across all exposure classes, the probability of default is falling. Indeed, the quality of counterparties has improved (migration of populations to the best risk classes) due in particular to government measures taken in the Covid context. Since the risk scores are mainly based on the number of days of arrears and the cash balance, they are impacted by: (i) the implementation of a moratorium on the repayment of loans, (ii) the increase in cash balances by the payment of loans guaranteed by the State (Prêts de Garantie par l’Etat) and by the payment by the State of various aid in support of the economy in the context of the COVID crisis for professionals, (iii) the observation of an increase of the personal savings rate during the COVID crisis.
It should be noted that new internal models, the development of which is finalised / planned, will make it possible to comply with the latest regulatory requirements.
See also tables 41 to 44 “Internal approach – Backtesting of PD per exposure class (fixed PD scale)” on the following pages.
31.12.2021
Number of obligors
at the end of the year
Observed
average default
rate (%)
31.12.2021
Exposures
weighted
average PD (%)
31.12.2020
Average PD (%)
Average
historical
annual default
rate (%)
Exposure class
PD scale
of which number
of obligors
which defaulted
during the year
Central governments and central banks
0.00 to < 0.15
348
-
-
0.01%
0.02%
0.06%
0.00 to < 0.10
341
-
-
0.01%
0.02%
0.05%
0.10 to < 0.15
7
-
-
0.13%
0.13%
0.58%
0.15 to < 0.25
-
-
-
-
-
-
0.25 to < 0.50
10
-
-
0.26%
0.26%
-
0.50 to < 0.75
7
-
-
0.50%
0.50%
-
0.75 to < 2.50
15
-
-
1.55%
1.74%
0.33%
0.75 to < 1.75
6
-
-
1.10%
1.10%
0.68%
1.75 to < 2.50
9
-
-
2.12%
2.12%
-
2.50 to < 10.00
53
-
-
4.98%
4.77%
0.58%
2.50 to < 5.00
37
-
-
4.01%
3.48%
0.38%
5.00 to < 10.00
16
-
-
7.76%
7.76%
1.00%
10.00 to < 100.00
18
1
5.56%
16.32%
15.15%
2.95%
10.00 to < 20.00
14
1
7.14%
12.55%
12.67%
0.69%
20.00 to < 30.00
4
-
-
20.46%
23.84%
13.72%
30.00 to < 100.00
-
-
-
-
-
-
100.00 (default)
7
7
-
100.00%
100.00%
-
Institutions
0.00 to < 0.15
2,487
-
-
0.04%
0.05%
0.20%
0.00 to < 0.10
2,135
-
-
0.03%
0.04%
0.19%
0.10 to < 0.15
352
-
-
0.13%
0.13%
0.27%
0.15 to < 0.25
-
-
-
-
-
-
0.25 to < 0.50
292
-
-
0.26%
0.26%
0.07%
0.50 to < 0.75
134
1
0.75%
0.50%
0.50%
0.24%
0.75 to < 2.50
115
-
-
1.54%
1.52%
0.31%
0.75 to < 1.75
68
-
-
1.10%
1.10%
0.27%
1.75 to < 2.50
47
-
-
2.12%
2.12%
0.39%
2.50 to < 10.00
389
1
0.26%
4.66%
3.78%
0.81%
2.50 to < 5.00
355
1
0.28%
3.94%
3.40%
0.66%
5.00 to < 10.00
34
-
-
7.76%
7.76%
1.18%
10.00 to < 100.00
63
1
1.59%
14.59%
15.68%
4.39%
10.00 to < 20.00
49
-
-
13.21%
12.99%
2.05%
20.00 to < 30.00
14
1
7.14%
21.19%
25.30%
10.35%
30.00 to < 100.00
-
-
-
-
-
-
100.00 (default)
22
22
-
100.00%
100.00%
-
Corporate – SME
0.00 to < 0.15
3,186
3
0.09%
0.10%
0.10%
0.32%
0.00 to < 0.10
1,008
-
-
0.05%
0.07%
0.31%
0.10 to < 0.15
2,178
3
0.14%
0.13%
0.13%
0.31%
0.15 to < 0.25
2,046
11
0.54%
0.20%
0.18%
0.31%
0.25 to < 0.50
5,836
24
0.41%
0.30%
0.31%
0.46%
0.50 to < 0.75
5,778
15
0.26%
0.53%
0.55%
0.71%
0.75 to < 2.50
15,135
65
0.43%
1.53%
1.38%
1.61%
0.75 to < 1.75
9,281
30
0.32%
1.18%
1.18%
1.24%
1.75 to < 2.50
5,854
35
0.60%
2.19%
2.06%
2.01%
2.50 to < 10.00
21,803
329
1.51%
4.58%
4.47%
4.36%
2.50 to < 5.00
15,877
194
1.22%
3.78%
3.58%
3.65%
5.00 to < 10.00
5,926
135
2.28%
7.74%
7.36%
6.68%
10.00 to < 100.00
7,542
541
7.17%
17.41%
18.83%
15.29%
10.00 to < 20.00
5,081
263
5.18%
13.19%
14.09%
12.20%
20.00 to < 30.00
2,083
218
10.47%
25.41%
26.06%
20.37%
30.00 to < 100.00
378
60
15.87%
33.55%
33.14%
25.13%
100.00 (default)
5,787
5,787
-
100.00%
100.00%
-
Corporate – Specialised lending
0.00 to < 0.15
166
-
-
0.31%
0.07%
0.29%
0.00 to < 0.10
102
-
-
0.05%
0.04%
0.27%
0.10 to < 0.15
64
-
-
0.55%
0.13%
0.39%
0.15 to < 0.25
-
-
-
-
-
-
0.25 to < 0.50
136
2
1.47%
0.27%
0.26%
0.22%
0.50 to < 0.75
345
1
0.29%
0.53%
0.50%
0.45%
0.75 to < 2.50
837
7
0.84%
1.61%
1.66%
0.94%
0.75 to < 1.75
380
5
1.32%
1.15%
1.10%
0.55%
1.75 to < 2.50
457
2
0.44%
2.18%
2.12%
1.34%
2.50 to < 10.00
663
5
0.75%
4.32%
4.46%
2.78%
2.50 to < 5.00
539
3
0.56%
3.82%
3.70%
2.03%
5.00 to < 10.00
124
2
1.61%
7.11%
7.77%
5.52%
10.00 to < 100.00
108
7
6.48%
16.57%
16.35%
11.63%
10.00 to < 20.00
75
2
2.67%
12.09%
12.73%
9.39%
20.00 to < 30.00
33
5
15.15%
22.66%
24.57%
19.12%
30.00 to < 100.00
-
-
-
-
-
-
100.00 (default)
93
93
-
100.00%
100.00%
-
Corporate – Other
0.00 to < 0.15
3,152
-
-
0.07%
0.08%
0.15%
0.00 to < 0.10
1,910
-
-
0.04%
0.04%
0.15%
0.10 to < 0.15
1,242
-
-
0.13%
0.13%
0.15%
0.15 to < 0.25
66
-
-
0.17%
0.16%
-
0.25 to < 0.50
1,517
2
0.13%
0.26%
0.26%
0.23%
0.50 to < 0.75
2,387
6
0.25%
0.50%
0.51%
0.43%
0.75 to < 2.50
5,391
28
0.52%
1.58%
1.57%
1.19%
0.75 to < 1.75
3,011
14
0.46%
1.11%
1.13%
0.90%
1.75 to < 2.50
2,380
14
0.59%
2.14%
2.12%
1.52%
2.50 to < 10.00
9,449
119
1.26%
4.52%
4.44%
3.16%
2.50 to < 5.00
7,402
75
1.01%
3.75%
3.60%
2.81%
5.00 to < 10.00
2,047
44
2.15%
7.83%
7.48%
4.50%
10.00 to < 100.00
2,663
146
5.48%
15.24%
16.25%
10.96%
10.00 to < 20.00
1,866
60
3.22%
12.64%
12.56%
8.83%
20.00 to < 30.00
764
79
10.34%
21.41%
24.57%
15.53%
30.00 to < 100.00
33
7
21.21%
33.99%
34.02%
2.30%
100.00 (default)
1,644
1,644
-
100.00%
100.00%
-
Retail – Secured by real estate SME
0.00 to < 0.15
169
1
0.59%
0.04%
0.01%
0.43%
0.00 to < 0.10
169
1
0.59%
0.04%
0.01%
0.43%
0.10 to < 0.15
-
-
-
-
-
-
0.15 to < 0.25
24
-
-
0.24%
0.23%
0.23%
0.25 to < 0.50
4,664
13
0.28%
0.27%
0.27%
0.28%
0.50 to < 0.75
12,130
57
0.47%
0.62%
0.62%
0.37%
0.75 to < 2.50
11,895
96
0.81%
1.04%
1.06%
0.98%
0.75 to < 1.75
11,758
95
0.81%
1.04%
1.05%
0.94%
1.75 to < 2.50
137
1
0.73%
2.14%
1.78%
1.93%
2.50 to < 10.00
3,132
55
1.76%
2.83%
2.84%
2.48%
2.50 to < 5.00
2,936
42
1.43%
2.57%
2.57%
2.24%
5.00 to < 10.00
196
13
6.63%
6.90%
6.90%
5.05%
10.00 to < 100.00
1,461
147
10.06%
15.46%
15.37%
14.84%
10.00 to < 20.00
1,373
135
9.83%
14.72%
14.64%
14.38%
20.00 to < 30.00
88
12
13.64%
26.83%
26.83%
19.18%
30.00 to < 100.00
-
-
-
-
-
-
100.00 (default)
978
978
-
100.00%
100.00%
-
Retail – Secured by real estate non-SME
0.00 to < 0.15
378,321
127
0.03%
0.07%
0.07%
0.07%
0.00 to < 0.10
378,321
127
0.03%
0.07%
0.07%
0.07%
0.10 to < 0.15
-
0.18%
-
-
0.15 to < 0.25
306,076
260
0.08%
0.22%
0.21%
0.13%
0.25 to < 0.50
116,905
210
0.18%
0.41%
0.41%
0.21%
0.50 to < 0.75
131,770
236
0.18%
0.62%
0.61%
0.37%
0.75 to < 2.50
171,189
825
0.48%
1.60%
1.40%
0.63%
0.75 to < 1.75
107,023
435
0.41%
1.03%
1.03%
0.52%
1.75 to < 2.50
64,166
390
0.61%
2.08%
2.06%
1.24%
2.50 to < 10.00
57,837
1,025
1.77%
4.95%
4.72%
2.70%
2.50 to < 5.00
36,016
478
1.33%
3.27%
3.19%
1.83%
5.00 to < 10.00
21,821
547
2.51%
6.94%
7.04%
4.73%
10.00 to < 100.00
9,452
837
8.86%
17.80%
19.24%
14.88%
10.00 to < 20.00
7,455
508
6.81%
16.06%
16.11%
13.28%
20.00 to < 30.00
1,510
167
11.06%
24.48%
23.92%
17.36%
30.00 to < 100.00
487
162
33.26%
47.07%
51.86%
38.27%
100.00 (default)
14,261
14,261
-
100.00%
100.00%
-
Retail – Qualifying revolving
0.00 to < 0.15
1,641,405
1,423
0.09%
0.08%
0.09%
0.08%
0.00 to < 0.10
1,197,039
1,058
0.09%
0.07%
0.06%
0.02%
0.10 to < 0.15
444,366
365
0.08%
0.11%
0.12%
0.08%
0.15 to < 0.25
44,156
68
0.15%
0.24%
0.23%
0.13%
0.25 to < 0.50
1,170,445
3,130
0.27%
0.45%
0.41%
0.41%
0.50 to < 0.75
125,987
485
0.38%
0.60%
0.62%
0.36%
0.75 to < 2.50
1,329,939
10,581
0.80%
1.38%
1.39%
0.87%
0.75 to < 1.75
858,332
5,312
0.62%
1.13%
1.13%
0.92%
1.75 to < 2.50
471,607
5,269
1.12%
1.89%
2.00%
0.77%
2.50 to < 10.00
1,055,799
25,898
2.45%
4.91%
4.58%
3.02%
2.50 to < 5.00
611,708
9,876
1.61%
3.20%
2.97%
2.19%
5.00 to < 10.00
444,091
16,022
3.61%
6.73%
6.44%
4.21%
10.00 to < 100.00
334,174
38,731
11.59%
21.92%
21.83%
15.19%
10.00 to < 20.00
241,829
24,291
10.04%
14.32%
15.39%
9.66%
20.00 to < 30.00
11,657
1,613
13.84%
25.14%
25.03%
14.82%
30.00 to < 100.00
80,688
12,827
15.90%
40.80%
38.16%
56.87%
100.00 (default)
184,626
184,626
-
100.00%
100.00%
-
Retail – Other SME
0.00 to < 0.15
376
-
-
0.07%
0.06%
0.07%
0.00 to < 0.10
376
-
-
0.06%
0.06%
0.07%
0.10 to < 0.15
-
-
-
0.13%
-
-
0.15 to < 0.25
38,033
186
0.49%
0.23%
0.22%
0.29%
0.25 to < 0.50
190,909
603
0.32%
0.37%
0.34%
0.22%
0.50 to < 0.75
70,607
547
0.77%
0.57%
0.58%
0.58%
0.75 to < 2.50
275,430
3,067
1.11%
1.44%
1.47%
1.18%
0.75 to < 1.75
201,855
2,049
1.02%
1.30%
1.22%
1.00%
1.75 to < 2.50
73,575
1,018
1.38%
2.05%
2.04%
1.58%
2.50 to < 10.00
139,367
5,061
3.63%
4.99%
4.92%
4.03%
2.50 to < 5.00
83,910
3,006
3.58%
3.70%
3.87%
3.50%
5.00 to < 10.00
55,457
2,055
3.71%
6.59%
6.41%
4.89%
10.00 to < 100.00
56,104
7,654
13.64%
18.75%
17.97%
13.23%
10.00 to < 20.00
38,251
3,731
9.75%
13.07%
11.96%
8.58%
20.00 to < 30.00
12,347
2,299
18.62%
25.32%
23.07%
13.86%
30.00 to < 100.00
5,506
1,624
29.50%
39.78%
40.18%
34.95%
100.00 (default)
43,010
43,010
-
100.00%
100.00%
-
Retail – Other non-SME
0.00 to < 0.15
33,496
22
0.07%
0.09%
0.09%
0.07%
0.00 to < 0.10
26,804
21
0.08%
0.09%
0.09%
0.07%
0.10 to < 0.15
6,692
1
0.01%
0.10%
0.11%
0.07%
0.15 to < 0.25
233,442
148
0.06%
0.20%
0.20%
0.17%
0.25 to < 0.50
358,109
856
0.24%
0.40%
0.35%
0.32%
0.50 to < 0.75
191,111
794
0.42%
0.62%
0.66%
0.46%
0.75 to < 2.50
479,546
3,049
0.64%
1.36%
1.44%
0.95%
0.75 to < 1.75
373,545
2,062
0.55%
1.15%
1.23%
0.79%
1.75 to < 2.50
106,001
987
0.93%
2.06%
2.12%
1.44%
2.50 to < 10.00
415,438
9,956
2.40%
4.23%
4.71%
3.14%
2.50 to < 5.00
259,312
3,608
1.39%
3.29%
3.28%
2.16%
5.00 to < 10.00
156,126
6,348
4.07%
6.68%
7.00%
4.66%
10.00 to < 100.00
113,369
15,555
13.72%
25.18%
27.53%
20.76%
10.00 to < 20.00
42,241
2,868
6.79%
13.58%
13.21%
10.03%
20.00 to < 30.00
25,866
3,356
12.97%
23.85%
23.72%
16.57%
30.00 to < 100.00
45,262
9,331
20.62%
42.86%
42.08%
34.37%
100.00 (default)
163,744
163,744
-
100.00%
100.00%
-
31.12.2021
Number of obligors
at the end of the year
Observed
average default
rate (%)
31.12.2021
Exposures
weighted
average PD (%)
31.12.2020
Average PD (%)
Average
historical
annual default
rate (%)
Exposure class
PD scale
of which number
of obligors
which defaulted
during the year
Central governments and central banks
0.00 to < 0.15
102
-
-
0.01%
0.02%
-
0.00 to < 0.10
102
-
-
0.01%
0.02%
-
0.10 to < 0.15
-
-
-
-
-
-
0.15 to < 0.25
-
-
-
-
-
-
0.25 to < 0.50
-
-
-
-
-
-
0.50 to < 0.75
-
-
-
-
-
-
0.75 to < 2.50
-
-
-
0.01%
-
-
0.75 to < 1.75
-
-
-
0.01%
-
-
1.75 to < 2.50
-
-
-
0.01%
-
-
2.50 to < 10.00
-
-
-
2.46%
-
-
2.50 to < 5.00
-
-
-
3.26%
-
-
5.00 to < 10.00
-
-
-
-
-
-
10.00 to < 100.00
-
-
-
-
-
-
10.00 to < 20.00
-
-
-
-
-
-
20.00 to < 30.00
-
-
-
-
-
-
30.00 to < 100.00
-
-
-
-
-
-
100.00 (default)
-
-
-
-
-
-
Institutions
0.00 to < 0.15
18
-
-
0.05%
0.04%
0.06%
0.00 to < 0.10
17
-
-
0.03%
0.03%
0.06%
0.10 to < 0.15
1
-
-
0.13%
0.13%
-
0.15 to < 0.25
-
-
-
-
-
-
0.25 to < 0.50
1
-
-
0.26%
0.26%
-
0.50 to < 0.75
-
-
-
0.50%
-
-
0.75 to < 2.50
4
-
-
2.12%
1.36%
-
0.75 to < 1.75
3
-
-
-
1.10%
-
1.75 to < 2.50
1
-
-
2.12%
2.12%
-
2.50 to < 10.00
3
-
-
5.73%
3.71%
0.85%
2.50 to < 5.00
3
-
-
3.26%
3.71%
1.05%
5.00 to < 10.00
-
-
-
7.76%
-
-
10.00 to < 100.00
1
-
-
-
14.33%
6.35%
10.00 to < 20.00
1
-
-
-
14.33%
2.47%
20.00 to < 30.00
-
-
-
-
-
7.05%
30.00 to < 100.00
-
-
-
-
-
-
100.00 (default)
-
-
-
-
-
-
Corporate – SME
0.00 to < 0.15
188
-
-
0.12%
0.13%
0.29%
0.00 to < 0.10
9
-
-
0.04%
0.05%
0.13%
0.10 to < 0.15
179
-
-
0.13%
0.13%
0.38%
0.15 to < 0.25
277
-
-
0.16%
0.16%
0.01%
0.25 to < 0.50
457
3
0.66%
0.29%
0.29%
0.45%
0.50 to < 0.75
1,008
2
0.20%
0.55%
0.56%
0.63%
0.75 to < 2.50
2,728
15
0.55%
1.59%
1.55%
1.65%
0.75 to < 1.75
1,684
6
0.36%
1.20%
1.20%
1.19%
1.75 to < 2.50
1,044
9
0.86%
2.24%
2.12%
2.22%
2.50 to < 10.00
4,893
111
2.27%
4.53%
4.64%
5.04%
2.50 to < 5.00
3,399
79
2.32%
3.73%
3.56%
4.26%
5.00 to < 10.00
1,494
32
2.14%
7.40%
7.12%
7.85%
10.00 to < 100.00
1,669
144
8.63%
17.24%
16.97%
16.16%
10.00 to < 20.00
1,190
78
6.55%
13.33%
13.19%
12.08%
20.00 to < 30.00
393
45
11.45%
24.51%
24.35%
22.59%
30.00 to < 100.00
101
21
20.79%
33.66%
33.32%
2.01%
100.00 (default)
965
965
-
100.00%
100.00%
-
Corporate – Other
0.00 to < 0.15
572
1
0.17%
0.07%
0.08%
0.09%
0.00 to < 0.10
336
1
0.30%
0.06%
0.05%
0.06%
0.10 to < 0.15
236
-
-
0.13%
0.13%
0.11%
0.15 to < 0.25
15
-
-
0.17%
0.16%
-
0.25 to < 0.50
289
1
0.35%
0.26%
0.26%
0.22%
0.50 to < 0.75
496
2
0.40%
0.51%
0.52%
0.34%
0.75 to < 2.50
1,268
9
0.71%
1.77%
1.55%
1.02%
0.75 to < 1.75
749
5
0.67%
1.17%
1.16%
0.70%
1.75 to < 2.50
519
4
0.77%
2.33%
2.12%
1.41%
2.50 to < 10.00
3,021
53
1.75%
4.85%
4.23%
3.52%
2.50 to < 5.00
2,454
38
1.55%
3.78%
3.53%
3.02%
5.00 to < 10.00
567
15
2.65%
7.80%
7.25%
5.61%
10.00 to < 100.00
850
65
7.65%
17.07%
17.03%
11.97%
10.00 to < 20.00
567
32
5.64%
13.17%
12.76%
9.27%
20.00 to < 30.00
263
28
10.65%
24.64%
24.97%
16.29%
30.00 to < 100.00
20
5
25.00%
33.30%
34.06%
2.61%
100.00 (default)
253
253
-
100.00%
100.00%
-
31.12.2021
External rating
equivalent (S&P)
Number of obligors
at the end of the year
Observed
average default
rate (%)
31.12.2020
Average PD
(%)
Average
historical
annual default
rate (%)
Exposure class
PD range
of which number
of obligors which
defaulted during
the year
Central governments and central banks
0.000 to < 0.011
AAA
31
-
-
0.01%
0.05%
0.011 to < 0.017
AA+
240
-
-
0.01%
-
0.017 to < 0.023
AA
45
-
-
0.02%
-
0.023 to < 0.029
AA-
10
-
-
0.03%
-
0.029 to < 0.034
A+
13
-
-
0.03%
-
0.034 to < 0.047
A
5
-
-
0.04%
-
0.047 to < 0.089
A-
4
-
-
0.06%
-
0.089 to < 0.183
BBB+
7
-
-
0.13%
0.58%
0.183 to < 0.359
BBB
10
-
-
0.26%
-
0.359 to < 0.743
BBB-
7
-
-
0.50%
-
0.743 to < 1.529
BB+
6
-
-
1.10%
0.68%
1.529 to < 2.632
BB
9
-
-
2.12%
-
2.632 to < 3.877
BB-
31
-
-
3.26%
0.61%
3.877 to < 5.983
B+
6
-
-
4.61%
-
5.983 to < 9.414
B
16
-
-
7.76%
0.76%
9.414 to < 12.792
B-
8
-
-
11.42%
0.38%
12.792 to < 17.113
CCC+
6
1
16.67%
14.33%
1.97%
17.113 to < 23.6
CCC
2
-
-
20.44%
11.54%
23.60 to < 100.00
C / CC / CCC-
2
-
-
27.25%
11.53%
100.00 (default)
D / SD
7
7
-
100.00%
-
Institutions
0.000 to < 0.011
AAA
1
-
-
-
0.19%
0.011 to < 0.017
AA+
-
-
-
-
-
0.017 to < 0.023
AA
-
-
-
-
-
0.023 to < 0.029
AA-
-
-
-
-
-
0.029 to < 0.034
A+
1,467
-
-
0.03%
0.16%
0.034 to < 0.047
A
277
-
-
0.04%
0.42%
0.047 to < 0.089
A-
398
-
-
0.06%
0.21%
0.089 to < 0.183
BBB+
352
-
-
0.13%
-
0.183 to < 0.359
BBB
292
-
-
0.26%
0.07%
0.359 to < 0.743
BBB-
134
1
0.75%
0.50%
0.24%
0.743 to < 1.529
BB+
68
-
-
1.10%
0.27%
1.529 to < 2.632
BB
47
-
-
2.12%
0.11%
2.632 to < 3.877
BB-
320
1
0.31%
3.26%
0.65%
3.877 to < 5.983
B+
38
-
-
4.61%
1.03%
5.983 to < 9.414
B
34
-
-
7.76%
1.18%
9.414 to < 12.792
B-
23
-
-
11.42%
2.32%
12.792 to < 17.113
CCC+
27
-
-
14.33%
1.53%
17.113 to < 23.6
CCC
4
-
-
20.44%
6.63%
23.60 to < 100.00
C / CC / CCC-
10
1
10.00%
27.25%
15.37%
100.00 (default)
D / SD
22
22
-
100.00%
-
Corporate – SME
0.000 to < 0.011
AAA
-
-
-
-
-
0.011 to < 0.017
AA+
-
-
-
-
-
0.017 to < 0.023
AA
-
-
-
-
-
0.023 to < 0.029
AA-
-
-
-
-
-
0.029 to < 0.034
A+
45
-
-
0.03%
0.13%
0.034 to < 0.047
A
23
1
4.35%
0.04%
0.96%
0.047 to < 0.089
A-
937
-
-
0.06%
0.14%
0.089 to < 0.183
BBB+
3,085
3
0.10%
0.11%
0.31%
0.183 to < 0.359
BBB
6,506
26
0.40%
0.28%
0.47%
0.359 to < 0.743
BBB-
5,793
16
0.28%
1.03%
0.71%
0.743 to < 1.529
BB+
9,222
30
0.33%
1.17%
1.24%
1.529 to < 2.632
BB
7,415
49
0.66%
2.01%
0.46%
2.632 to < 3.877
BB-
8,076
113
1.40%
3.25%
3.07%
3.877 to < 5.983
B+
7,661
88
1.15%
4.59%
4.69%
5.983 to < 9.414
B
4,641
117
2.52%
7.78%
6.63%
9.414 to < 12.792
B-
2,688
105
3.91%
10.69%
11.73%
12.792 to < 17.113
CCC+
1,965
125
6.36%
14.94%
13.38%
17.113 to < 23.6
CCC
1,223
104
8.50%
19.07%
17.25%
23.60 to < 100.00
C / CC / CCC-
1,716
210
12.24%
28.10%
23.39%
100.00 (default)
D / SD
5,787
5,787
-
100.00%
-
Corporate – Specialised lending
0.000 to < 0.011
AAA
19
-
-
-
3.85%
0.011 to < 0.017
AA+
-
-
-
-
-
0.017 to < 0.023
AA
-
-
-
-
-
0.023 to < 0.029
AA-
-
-
-
-
-
0.029 to < 0.034
A+
30
-
-
0.03%
0.60%
0.034 to < 0.047
A
22
-
-
0.04%
0.13%
0.047 to < 0.089
A-
32
-
-
0.06%
-
0.089 to < 0.183
BBB+
64
-
-
0.13%
0.39%
0.183 to < 0.359
BBB
136
2
1.47%
0.26%
0.22%
0.359 to < 0.743
BBB-
345
1
0.29%
0.50%
0.44%
0.743 to < 1.529
BB+
380
5
1.32%
1.10%
0.54%
1.529 to < 2.632
BB
457
2
0.44%
2.12%
0.13%
2.632 to < 3.877
BB-
365
1
0.27%
3.26%
1.59%
3.877 to < 5.983
B+
174
2
1.15%
4.61%
2.89%
5.983 to < 9.414
B
124
2
1.61%
7.77%
5.55%
9.414 to < 12.792
B-
41
1
2.44%
11.42%
7.40%
12.792 to < 17.113
CCC+
34
1
2.94%
14.31%
18.55%
17.113 to < 23.6
CCC
13
3
23.08%
20.44%
19.53%
23.60 to < 100.00
C / CC / CCC-
20
2
10.00%
27.25%
22.14%
100.00 (default)
D / SD
93
93
-
100.00%
-
Corporate – Other
0.000 to < 0.011
AAA
47
-
-
-
3.12%
0.011 to < 0.017
AA+
-
-
-
-
-
0.017 to < 0.023
AA
-
-
-
-
-
0.023 to < 0.029
AA-
-
-
-
-
-
0.029 to < 0.034
A+
786
-
-
0.03%
0.11%
0.034 to < 0.047
A
256
-
-
0.04%
0.14%
0.047 to < 0.089
A-
831
-
-
0.06%
0.15%
0.089 to < 0.183
BBB+
1,306
-
-
0.13%
0.14%
0.183 to < 0.359
BBB
1,517
2
0.13%
0.26%
0.22%
0.359 to < 0.743
BBB-
2,387
6
0.25%
0.51%
0.42%
0.743 to < 1.529
BB+
3,011
14
0.46%
1.13%
0.89%
1.529 to < 2.632
BB
2,573
15
0.58%
2.16%
0.30%
2.632 to < 3.877
BB-
4,999
48
0.96%
3.24%
2.35%
3.877 to < 5.983
B+
2,432
33
1.36%
4.57%
3.61%
5.983 to < 9.414
B
1,856
38
2.05%
7.68%
4.45%
9.414 to < 12.792
B-
1,181
40
3.39%
11.27%
9.11%
12.792 to < 17.113
CCC+
624
18
2.88%
14.31%
9.21%
17.113 to < 23.6
CCC
366
33
9.02%
19.88%
16.02%
23.60 to < 100.00
C / CC / CCC-
512
56
10.94%
27.48%
15.43%
100.00 (default)
D / SD
1,644
1,644
-
100.00%
-
31.12.2021
External rating
equivalent (S&P)
Number of obligors
at the end of the year
Observed
average default
rate (%)
31.12.2020
Average PD
(%)
Average
historical
annual default
rate (%)
Exposure class
PD range
of which number
of obligors which
defaulted during
the year
Central governments and central banks
0.000 to < 0.011
AAA
-
-
-
-
-
0.011 to < 0.017
AA+
-
-
-
-
-
0.017 to < 0.023
AA
93
-
-
0.01%
-
0.023 to < 0.029
AA-
7
-
-
0.02%
-
0.029 to < 0.034
A+
-
-
-
-
-
0.034 to < 0.047
A
-
-
-
-
-
0.047 to < 0.089
A-
1
-
-
0.04%
-
0.089 to < 0.183
BBB+
1
-
-
0.06%
-
0.183 to < 0.359
BBB
-
-
-
-
-
0.359 to < 0.743
BBB-
-
-
-
-
-
0.743 to < 1.529
BB+
-
-
-
-
-
1.529 to < 2.632
BB
-
-
-
-
-
2.632 to < 3.877
BB-
-
-
-
-
-
3.877 to < 5.983
B+
-
-
-
-
-
5.983 to < 9.414
B
-
-
-
-
-
9.414 to < 12.792
B-
-
-
-
-
-
12.792 to < 17.113
CCC+
-
-
-
-
-
17.113 to < 23.6
CCC
-
-
-
-
-
23.60 to < 100.00
C / CC / CCC-
-
-
-
-
-
100.00 (default)
D / SD
-
-
-
-
-
Institutions
0.000 to < 0.011
AAA
-
-
-
-
-
0.011 to < 0.017
AA+
-
-
-
-
-
0.017 to < 0.023
AA
-
-
-
-
-
0.023 to < 0.029
AA-
-
-
-
-
-
0.029 to < 0.034
A+
14
-
-
0.03%
0.03%
0.034 to < 0.047
A
2
-
-
0.04%
0.38%
0.047 to < 0.089
A-
1
-
-
0.06%
-
0.089 to < 0.183
BBB+
1
-
-
0.13%
-
0.183 to < 0.359
BBB
1
-
-
0.26%
-
0.359 to < 0.743
BBB-
-
-
-
-
-
0.743 to < 1.529
BB+
3
-
-
1.10%
-
1.529 to < 2.632
BB
1
-
-
2.12%
-
2.632 to < 3.877
BB-
2
-
-
3.26%
1.12%
3.877 to < 5.983
B+
1
-
-
4.61%
1.00%
5.983 to < 9.414
B
-
-
-
-
-
9.414 to < 12.792
B-
-
-
-
-
-
12.792 to < 17.113
CCC+
1
-
-
14.33%
-
17.113 to < 23.6
CCC
-
-
-
-
-
23.60 to < 100.00
C / CC / CCC-
-
-
-
-
-
100.00 (default)
D / SD
-
-
-
-
-
Corporate – SME
0.000 to < 0.011
AAA
-
-
-
-
-
0.011 to < 0.017
AA+
-
-
-
-
-
0.017 to < 0.023
AA
-
-
-
-
-
0.023 to < 0.029
AA-
-
-
-
-
-
0.029 to < 0.034
A+
3
-
-
0.03%
0.10%
0.034 to < 0.047
A
1
-
-
0.04%
0.25%
0.047 to < 0.089
A-
5
-
-
0.06%
0.09%
0.089 to < 0.183
BBB+
449
-
-
0.15%
0.37%
0.183 to < 0.359
BBB
457
3
0.66%
0.29%
0.45%
0.359 to < 0.743
BBB-
1,008
2
0.20%
0.56%
0.63%
0.743 to < 1.529
BB+
1,684
6
0.36%
1.20%
1.21%
1.529 to < 2.632
BB
1,437
15
1.04%
2.24%
0.59%
2.632 to < 3.877
BB-
1,746
59
3.38%
3.21%
3.65%
3.877 to < 5.983
B+
1,747
21
1.20%
4.64%
5.57%
5.983 to < 9.414
B
1,041
28
2.69%
7.81%
8.11%
9.414 to < 12.792
B-
543
26
4.79%
11.12%
11.36%
12.792 to < 17.113
CCC+
517
41
7.93%
14.15%
14.36%
17.113 to < 23.6
CCC
288
22
7.64%
19.00%
18.19%
23.60 to < 100.00
C / CC / CCC-
350
55
15.71%
28.51%
28.85%
100.00 (default)
D / SD
965
965
-
100.00%
-
Corporate – Other
0.000 to < 0.011
AAA
-
-
-
-
-
0.011 to < 0.017
AA+
-
-
-
-
-
0.017 to < 0.023
AA
-
-
-
-
-
0.023 to < 0.029
AA-
-
-
-
-
-
0.029 to < 0.034
A+
71
-
-
0.03%
0.02%
0.034 to < 0.047
A
88
-
-
0.04%
0.02%
0.047 to < 0.089
A-
177
1
0.56%
0.06%
0.13%
0.089 to < 0.183
BBB+
251
-
-
0.13%
0.10%
0.183 to < 0.359
BBB
289
1
0.35%
0.26%
0.22%
0.359 to < 0.743
BBB-
496
2
0.40%
0.52%
0.34%
0.743 to < 1.529
BB+
749
5
0.67%
1.16%
0.71%
1.529 to < 2.632
BB
590
4
0.68%
2.18%
0.32%
2.632 to < 3.877
BB-
1,744
33
1.89%
3.23%
2.64%
3.877 to < 5.983
B+
725
9
1.24%
4.56%
4.14%
5.983 to < 9.414
B
484
11
2.27%
7.55%
5.82%
9.414 to < 12.792
B-
329
24
7.29%
11.19%
8.99%
12.792 to < 17.113
CCC+
209
5
2.39%
14.33%
11.35%
17.113 to < 23.6
CCC
119
14
11.76%
19.79%
17.92%
23.60 to < 100.00
C / CC / CCC-
198
22
11.11%
27.80%
18.14%
100.00 (default)
D / SD
253
253
-
100.00%
-
Basel portfolio
31.12.2021
A-IRB LGD
Estimated losses
excluding margin
of prudence
Observed EAD/
A-IRB EAD
Real estate loans (excl. guaranteed exposures)
18%
9%
-
Revolving credits
48%
43%
66%
Other loans to individual customers
28%
23%
-
VSB and professionals
29%
22%
72%
TOTAL GROUP RETAIL CLIENTS
26%
19%
68%
Basel portfolio
31.12.2020
A-IRB LGD
Estimated losses
excluding margin
of prudence
Observed EAD/
A-IRB EAD
Real estate loans (excl. guaranteed exposures)
18%
11%
-
Revolving credits
46%
41%
74%
Other loans to individual customers
28%
24%
-
VSB and professionals
28%
22%
79%
TOTAL GROUP RETAIL CLIENTS
25%
20%
75%
Credit own funds estimation models are subject to the global model risk management framework (see Chapter 4.12 “Model risk” of the 2022 Universal Registration Document).
The first line of defence is responsible for designing, putting into production, using and monitoring models, in compliance with model risk management governance rules throughout the model lifecycle, which include for credit risk internal models traceability of development and implementation stages and annual backtesting. Depending on the specificities of each model family, in particular depending on the regulatory environment, the second line of defense may decide to perform the backtesting of the model family. In such case the LOD2 is responsible for defining a dedicated standard for the model family and informing the first line of defense (starting with the model owner) of the outcome of the backtesting.
The Model Risk Division, reporting directly to the Risk Division, acts as a second line of defense for all credit risk models. Independent model review teams rely, for the conduct of their missions, on principles of control of the theoretical robustness (assessment of the quality of the design and development) of the models, the conformity of the implementation and the use, the continuous follow-up of model relevance over time. The independent review process concludes with (i) a report summarizing the scope of the review, the tests performed, the results of the review, the conclusions or recommendations and with (ii) Reviewing and Approval Committees (respectively Comité Modèles and Comité Experts in the case of credit risk models). The model control system gives rise to recurring reports to the Risk Department within the framework of various bodies and processes (Group Model Risk Management Committee, Risk Appetite Statement / Risk Appetite Framework, monitoring of recommendations, etc.) and annually to the General Management (CORISQ). The Model Risk Division reviews, amongst others, new models, backtesting results and any change to the credit own funds estimation models. In accordance with the Delegated Regulation (EU) No. 529/2014 of 20 May 2014 relating to the follow-up of internal models used for own funds computation, any model change to the Group’s credit risk measurement system is then subjected to two main types of notification to the competent supervisor, depending on the significant nature of the change laid down by this regulation itself:
■other changes which should be notified to the competent authorities: (i) prior to their implementation: changes, according to the criteria defined by the regulation, are notified to the Supervisor (ex-ante notification); barring a negative response, these may be implemented within a two months period; (ii) after their implementation: these changes are notified to the competent authorities after their implementation at least once a year, through a specific report (ex-post notification).
The Internal Audit Department, as a third line of defence, is responsible for periodically assessing the overall effectiveness of the model risk management framework (relevance of the model risk governance and efficiency of second line of defence activities) and performing the independent model audit.
Transition risk’s impact on Societe Generale Corporate clients’ credit risk has been identified as one of the main climate change-related risk for the Group.
In order to measure this impact, the Group is gradually implementing a Corporate Climate Vulnerability Indicator (CCVI) which aims to reinforce the credit analysis on the most exposed counterparties.
The climate risk management system is further detailed in section 5.4.2 “Positive climate action” of the 2022 Universal Registration Document.
-
6.5 QUANTITATIVE INFORMATION
In this section, the measurement used for credit exposures is the EAD – Exposure At Default (on- and off-balance sheet). Under the standardised approach, the EAD is calculated net of collateral and provisions.
The EAD is broken down according to the guarantor’s characteristics, after taking into account the substitution effect (unless otherwise indicated).
The presentation of the data features the exposure classes as defined in the portfolios of the COREP regulatory financial statements, in relation to EBA requirements on Pillar 3.
Sovereigns
Claims or contingent claims on sovereign governments, regional authorities, local authorities or public sector entities as well as on multilateral development banks and international organisations.
Institutions
Claims or contingent claims on regulated credit institutions, as well as on governments, local authorities or other public sector entities that do not qualify as sovereign counterparties.
Corporates
Claims or contingent claims on corporates, which include all exposures not covered in the portfolios defined above. In addition, small/medium-sized enterprises are included in this category as a sub-portfolio, and are defined as entities with total annual sales below EUR 50 million.
Retail
Claims or contingent claims on an individual or individuals, or on a small or medium-sized entity, provided in the latter case that the total amount owed to the credit institution does not exceed EUR 1 million.
Retail exposure is further broken down into residential mortgages, revolving credit and other forms of credit to individuals, the remainder relating to exposures to very small entities and self-employed.
Others
Claims relating to securitisation transactions, equity, fixed assets, accruals, contributions to the default fund of a CCP, as well as exposures secured by mortgages on immovable property under the standardised approach, and exposures in default under the standardised approach.
EAD of the Corporate portfolio is presented in accordance with the Basel rules (large corporates, including insurance companies, funds and hedge funds, SMEs, specialised financing, factoring businesses), based on the obligor’s characteristics, before taking into account the substitution effect (credit risk scope: debtor, issuer and replacement risk).
As at 31 December 2021, the Corporate portfolio amounted to EUR 380 billion out of a total of EUR 1,079 billion for the group (on- and off-balance sheet exposures measured in EAD). The Group’s exposure to its ten largest Corporate counterparties accounted for 5% of this portfolio.
Regarding Corporate clients, the scope consists of performing loans recorded under the IRB approach (excluding prudential classification criteria, by weight, of specialised financing) over the entire Corporate clients portfolio, all divisions combined, and represents a EUR 295 billion EAD (out of a EUR 332 billion total EAD for the Corporate Basel portfolio, standardised approach included). The rating breakdown of Societe Generale Group’s Corporate counterparty exposure reveals the sound quality of the portfolio. It is based on an internal counterparty rating system, displayed above as its Standard & Poor’s equivalent.
As at 31 December 2021, the majority of the portfolio had an Investment Grade rating, i.e. counterparties with an S&P-equivalent internal rating higher than BBB- (69% of Corporate clients). Transactions with non-Investment Grade counterparties were very often backed by guarantees and collaterals in order to mitigate the risk incurred.
Regarding banking clients, the scope consists of performing loans recorded under the IRB approach over the entire banking clients portfolio, all divisions combined, and represents a EUR 56 billion EAD (out of a EUR 116 billion total EAD for the Institutions Basel portfolio, standardised approach included). The rating breakdown of Societe Generale Group’s banking counterparty exposure reveals the sound quality of the portfolio.
It is based on an internal counterparty rating system, displayed above as its Standard & Poor’s equivalent.
As at 31 December 2021, exposures on banking clients were concentrated on Investment Grade counterparties (93% of the exposure) and in developed countries (91%).
As at 31 December 2021, 90% of the Group’s on- and off-balance sheet exposures were concentrated in the advanced economies. Almost half of the overall amount of outstanding loans was towards French clients (32% exposure to the non-retail portfolio and 14% to the retail one).
The Group’s exposure to its top ten countries represented 83% of total exposure (i.e. EUR 898 billion of EAD) at 31 December 2021 (versus 84% and EUR 844 billion of EAD at 31 December 2020).
France
United States
United Kingdom
Germany
Czech Republic
2021
2020
2021
2020
2021
2020
2021
2020
2021
2020
Sovereign
30%
29%
30%
31%
16%
32%
16%
19%
29%
31%
Institutions
9%
9%
12%
16%
23%
18%
21%
16%
4%
4%
Corporates
22%
22%
44%
40%
39%
33%
26%
25%
29%
29%
Retail
31%
32%
0%
0%
6%
4%
18%
21%
36%
34%
Other
8%
8%
14%
13%
16%
13%
19%
19%
2%
2%
(In EURm)
RWA - IRB
RWA - Standard
RWA - Total
Capital
requirements -
IRB
Capital
requirements -
Standard
Capital
requirements -
total
RWA as at end of previous reporting period (31.12.2020)
187,407
96,708
284,115
14,993
7,737
22,729
Asset size
(2,599)
7,138
4,539
(208)
571
363
Asset quality
(1,204)
(23)
(1,227)
(96)
(2)
(98)
Model updates
3,185
(1,754)
1,431
255
(140)
114
Methodology and policy
1,633
3,345
4,978
131
268
398
Acquisitions and disposals
(38)
118
79
(3)
9
6
Foreign exchange movements
3,190
1,692
4,882
255
135
391
Other
795
2,459
3,254
64
197
260
RWA as at end of reporting period (31.12.2021)
192,368
109,682
302,051
15,389
8,775
24,164
■an increase linked to business growth representing EUR +4.5 billion. This upward evolution mainly regards retail activities and global banking advisory;
■a foreign exchange effect of EUR +4.9 billion, mainly related to the appreciation of the US dollar against the euro (EUR +2.3 billion), as well as that of the Czech crown (EUR +0.4 billion);
■a methodological effect of EUR +5.0 billion located on the counterparty credit risk generated by derivatives, following the replacement of the former CEM method by the SA-CCR approach;
■An other effect of EUR +3.3 billion, mainly related to the reclassification of automotive leasing commitments.
■asset size: organic changes in book size and composition (including the creation of new business lines and maturing loans) but excluding changes due to acquisitions and disposals of entities;
■asset quality: changes in the quality of the Bank’s assets due to changes in borrower risk, such as rating grade migration or similar effects;
■model updates: changes due to model implementation, changes in model scope or any changes intended to address model weaknesses;
■methodology and policy: changes due to methodological changes in calculations driven by regulatory changes, including both revisions to existing regulations and new regulations;
■foreign exchange movements: changes arising from market fluctuations, such as foreign currency translation movements;
■other: this category is used to capture changes that cannot be attributed to any other categories.
The Group’s net cost of risk in 2021 was EUR - 700 million, down by -79% compared to 2020. This cost of risk is thus down sharply compared to 2020, due to a very high level low cost of risk on defaulted outstandings (stage 3) and moderate reversals of provisions on sound outstandings (stage 1/stage 2) while maintaining a prudent provisioning policy in an environment that remains marked by strong uncertainties.
The cost of risk (expressed in basis points on the average of outstandings at the beginning of the period for the four quarters preceding the closing, including operating leases) thus stands at 13 basis points for the year 2021 compared to 64 basis points in 2020.
■In French Retail Banking, the cost of risk is down to 5 basis points in 2021 compared to 52 basis points in 2020. This CNR includes a recovery of 8 bps on sound outstandings (compared to the internship 1/internship 2 allocation of 30 bp in 2020).
■At 38 basis points in 2021 (compared to 96 basis points in 2020), the cost of risk for the International Retail Banking and Financial Services division decreased due to the slowdown in defaults and a recovery in 3 base points on stage 1/stage 2.
■The cost of risk for Global Banking and Investor Solutions posted a level of 5 basis points (compared to 57 basis points in 2020), reflecting a sharp drop in the cost of risk on defaulted outstandings (8 bp against 38 bp in 2020) and a slight recovery of 3 bp on healthy outstandings.
The following tables have been prepared in accordance with the technical instructions of the European Banking Authority (EBA) regarding the disclosure of non-performing and renegotiated exposures (EBA/ITS/2020/04).
They present the credit quality of restructured exposures and of performing and non-performing exposures, by geographical area and industry sector, with provisions and associated collateral, as well as details of the change over the period of outstanding loans and non-performing advances.
For information purposes, and in accordance with the ECB’s recommendations, the concepts of Basel default, impaired assets and non-performing exposures are aligned within the Group.
This ratio is calculated in accordance with the instructions relating to the requirements of prudential disclosures published by the EBA.
For Societe Generale Group, “restructured” debt refers to loans with amounts, terms or financial conditions contractually modified due to the borrower’s insolvency (whether insolvency has already occurred or will definitely occur unless the debt is restructured). Societe Generale aligns its definition of restructured loans with the EBA one.
Restructured debt does not include commercial renegotiations involving customers for whom the Bank has agreed to renegotiate the debt in order to maintain or develop a business relationship, in accordance with credit approval rules in force and without relinquishing any of the principal amounts or accrued interests.
Any situation leading to a credit restructuring and involving a loss of value greater than 1% of the original debt or in which the customer’s ability to repay the debt according to the new schedule appears compromised must result in the classification of the considered customer in Basel default and the classification of outstanding as impaired, in accordance with the EBA directives on the application of the definition of default according to Article 178 of European Regulation No. 575/2013. In this case, customers are kept in default for as long as the Bank is uncertain about their ability to honor their future commitments and at least for one year from the date of the restructuring. In other cases, an analysis of the customer’s situation makes it possible to estimate his ability to repay according to the new schedule. Otherwise, the customer is also transferred to Basel default.
The total balance sheet amount of restructured debt as at 31 December 2021 mainly corresponds to loans and receivables at amortised cost for an amount of EUR 8.1 billion.
(In EURm)
31.12.2021
Gross carrying amount/nominal amount
Accumulated impairment, accumulated negative changes
in fair value due to credit risk and provisions
Accu-
mulated
write-off
Collateral and
financial guarantees
received
Performing
exposures
Non-performing
exposures
Performing exposures –
accumulated impairment
and provisions
Non-performing exposures –
accumulated impairment,
accumulated negative changes
in fair value due to credit risk
and provisions
On perfor-
ming
exposures
On non
perfor-
ming
exposures
TOTAL
of which
stage
1(1)
of which
stage
2(2)
TOTAL
of which
stage
2(2)
of which
stage
3(3)
TOTAL
of which
stage
1(1)
of which
stage
2(2)
TOTAL
of which
stage
2(2)
of which
stage
3(3)
Cash balances at central banks and other demand deposits
204,473
204,453
20
-
-
-
-
-
-
-
-
-
-
9
-
Loans and advances
543,930
479,941
43,471
16,491
-
16,485
(2,815)
(1,143)
(1,672)
(8,382)
-
(8,382)
(1,592)
292,794
4,944
Central banks
8,050
8,050
-
13
-
13
(0)
(0)
-
(13)
-
(13)
-
-
-
General governments
27,619
18,325
606
115
-
115
(15)
(6)
(9)
(58)
-
(58)
(0)
5,859
40
Credit institutions
14,681
14,336
301
22
-
22
(5)
(4)
(1)
(7)
-
(7)
(0)
2,252
15
Other financial corporations
44,887
42,388
223
131
-
131
(15)
(11)
(5)
(124)
-
(124)
-
9,179
8
Non-financial corporations
224,118
195,068
20,202
8,635
-
8,628
(1,526)
(546)
(980)
(4,124)
-
(4,124)
(737)
107,930
3,094
of which SMEs
47,592
39,458
6,612
3,778
-
3,772
(597)
(180)
(417)
(2,024)
-
(2,024)
-
29,955
1,321
Households
224,575
201,774
22,139
7,574
-
7,574
(1,253)
(575)
(677)
(4,055)
-
(4,055)
(855)
167,574
1,787
Debt securities
62,609
62,163
248
107
-
107
(9)
(7)
(2)
(56)
-
(56)
-
6,654
-
Central banks
2,955
2,955
-
-
-
-
(0)
(0)
-
-
-
-
-
-
-
General governments
44,001
43,895
102
8
-
8
(6)
(5)
(1)
(6)
-
(6)
-
-
-
Credit institutions
5,100
5,052
48
-
-
-
(1)
(1)
(0)
-
-
-
-
118
-
Other financial corporations
4,789
4,513
98
-
-
-
(1)
(0)
(1)
-
-
-
-
1,922
-
Non-financial corporations
5,763
5,748
-
99
-
99
(1)
(1)
-
(50)
-
(50)
-
4,613
-
Off-balance- sheet exposures
382,724
370,571
12,153
1,001
-
1,001
(530)
(217)
(313)
(358)
-
(358)
-
65,756
219
Central banks
241
241
-
-
-
-
(0)
(0)
-
-
-
-
43
-
General governments
6,275
6,153
122
0
-
0
(3)
(1)
(1)
-
-
-
3,690
0
Credit institutions
98,433
98,073
360
-
-
-
(22)
(2)
(21)
-
-
-
526
-
Other financial corporations
52,621
52,342
279
0
-
0
(5)
(4)
(1)
-
-
-
7,610
-
Non-financial corporations
207,858
197,127
10,731
904
-
904
(438)
(183)
(256)
(333)
-
(333)
47,931
205
Households
17,297
16,635
661
97
-
97
(62)
(28)
(34)
(26)
-
(26)
5,957
14
TOTAL
1,193,736
1,117,128
55,892
17,599
-
17,593
(3,354)
(1,367)
(1,987)
(8,796)
-
(8,796)
(1,592)
365,213
5,163
(1)Assets without significant increase in credit risk since initial recognition.
(2)Assets with significant increase in credit risk since initial recognition, but not impaired..
(3)Impaired assets.
(In EURm)
31.12.2020
Gross carrying amount/nominal amount
Accumulated impairment, accumulated negative changes
in fair value due to credit risk and provisions
Accu-
mulated
write-off
Collateral and
financial guarantees
received
Performing
exposures
Non-performing
exposures
Performing exposures –
accumulated impairment
and provisions
Non-performing exposures –
accumulated impairment,
accumulated negative changes
in fair value due to credit risk
and provisions
On perfor-
ming
exposures
On non
perfor-
ming
exposures
TOTAL
of which
stage
1(1)
of which
stage
2(2)
TOTAL
of which
stage
2(2)
of which
stage
3(3)
TOTAL
of which
stage
1(1)
of which
stage
2(2)
TOTAL
of which
stage
2(2)
of which
stage
3(3)
Cash balances at central banks and other demand deposits
191,476
-
-
-
-
-
-
-
-
-
-
-
-
3
-
Loans and advances
496,521
423,989
49,852
17,040
-
17,040
(3,024)
(1,075)
(1,950)
(8,795)
-
(8,795)
(1,917)
257,287
4,240
Central banks
8,771
8,770
1
13
-
13
(0)
(0)
(0)
(13)
-
(13)
-
5
-
General governments
26,829
17,291
377
137
-
137
(14)
(5)
(9)
(67)
-
(67)
(0)
4,922
59
Credit institutions
13,458
12,967
490
33
-
33
(5)
(3)
(2)
(7)
-
(7)
(0)
1,600
23
Other financial corporations
31,512
29,609
209
142
-
142
(16)
(10)
(6)
(72)
-
(72)
-
6,718
24
Non-financial corporations
205,332
164,774
29,736
8,731
-
8,731
(1,689)
(496)
(1,193)
(4,512)
-
(4,512)
(854)
94,814
2,358
of which SMEs
44,633
36,479
6,312
3,705
-
3,705
(570)
(147)
(424)
(2,019)
-
(2,019)
-
25,943
912
Households
210,618
190,578
19,037
7,984
-
7,984
(1,301)
(561)
(740)
(4,124)
-
(4,124)
(1,063)
149,230
1,776
Debt securities
67,504
67,194
91
121
-
121
(5)
(5)
(1)
(45)
-
(45)
-
5,590
-
Central banks
4,563
4,522
41
-
-
-
(0)
(0)
(0)
-
-
-
-
-
-
General governments
47,727
47,679
19
13
-
13
(4)
(4)
(0)
(13)
-
(13)
-
-
-
Credit institutions
6,397
6,366
30
-
-
-
(0)
(0)
-
-
-
-
-
222
-
Other financial corporations
4,778
4,588
-
-
-
-
(0)
(0)
-
-
-
-
-
2,292
-
Non-financial corporations
4,039
4,039
-
108
-
108
(1)
(1)
-
(32)
-
(32)
-
3,076
-
Off-balance- sheet exposures
336,234
308,236
27,998
1,160
-
1,160
(591)
(162)
(429)
(337)
-
(337)
-
51,849
222
Central banks
42
42
-
-
-
-
(0)
(0)
-
-
-
-
-
-
General governments
7,045
6,964
80
0
-
0
(1)
(1)
(1)
-
-
-
3,324
-
Credit institutions
75,742
75,204
538
0
-
0
(64)
(2)
(63)
-
-
-
317
-
Other financial corporations
58,682
58,388
294
12
-
12
(7)
(5)
(2)
(2)
-
(2)
5,234
-
Non-financial corporations
179,597
153,032
26,565
1,058
-
1,058
(459)
(129)
(331)
(317)
-
(317)
38,257
208
Households
15,126
14,606
521
89
-
89
(58)
(27)
(32)
(18)
-
(18)
4,716
14
TOTAL
1,091,735
799,419
77,940
18,321
-
18,321
(3,621)
(1,242)
(2,379)
(9,177)
-
(9,177)
(1,917)
314,730
4,462
(1)Assets without significant increase in credit risk since initial recognition.
(2)Assets with significant increase in credit risk since initial recognition, but not impaired.
(3)Impaired assets.
(In EURm)
31.12.2021
Gross carrying value
defaulted exposures
Initial stock of non-performing loans and advances
17,040
Inflows to non-performing portfolios
3,085
Outflows from non-performing portfolios
(3,634)
Outflows due to write-offs
(1,592)
Outflow due to other situations
(2,042)
Final stock of non-performing loans and advances
16,491
(In EURm)
31.12.2021
Gross carrying amount/nominal
amount of exposures with
forbearance measures
Accumulated impairment,
accumulated negative changes
in fair value due to credit risk
and provisions
Collateral received and financial
guarantees received on forborne
exposures
Performing
forborne
Non-performing forborne
On
performing
forborne
exposures
On
non-performing
forborne
exposures
TOTAL
of which collateral and
financial guarantees
received on
non-performing
exposures with
forbearance measures
TOTAL
of which
defaulted
of which
impaired
Cash balances
at central banks
and other demand deposits-
-
-
-
-
-
-
-
Loans and advances
4,879
3,308
3,308
3,302
(58)
(1,239)
5,020
1,372
Central banks
-
-
-
-
-
-
-
-
General governments
28
-
-
-
-
-
-
-
Credit institutions
-
-
-
-
-
-
-
-
Other financial corporations
11
0
0
0
(0)
(0)
11
-
Non-financial corporations
3,665
2,051
2,051
2,046
(58)
(701)
4,229
1,109
Households
1,175
1,256
1,256
1,256
(0)
(538)
780
263
Debt Securities
-
-
-
-
-
-
-
-
Loan commitments given
545
34
34
34
(8)
(2)
488
19
TOTAL
5,424
3,342
3,342
3,336
(66)
(1,241)
5,508
1,391
(In EURm)
31.12.2020
Gross carrying amount/nominal
amount of exposures with
forbearance measures
Accumulated impairment,
accumulated negative changes
in fair value due to credit risk
and provisions
Collateral received and financial
guarantees received on forborne
exposures
Performing
forborne
Non-performing forborne
On
performing
forborne
exposures
On
non-performing
forborne
exposures
TOTAL
of which collateral and
financial guarantees
received on
non-performing
exposures with
forbearance measures
TOTAL
of which
defaulted
of which
impaired
Loans and advances
1,210
2,438
2,438
2,438
(17)
(1,010)
992
613
Central banks
-
-
-
-
-
-
-
-
General governments
0
-
-
-
(0)
-
-
-
Credit institutions
-
-
-
-
-
-
-
-
Other financial corporations
7
1
1
1
-
(0)
8
1
Non-financial corporations
704
1,179
1,179
1,179
(17)
(487)
759
477
Households
499
1,258
1,258
1,258
(0)
(524)
225
135
Debt Securities
-
-
-
-
-
-
-
-
Loan commitments given
12
31
31
31
(1)
(2)
15
13
TOTAL
1,223
2,470
2,470
2,470
(18)
(1,012)
1,006
626
(In EURm)
31.12.2021
Performing exposures
Non-performing exposures
TOTAL
performingNot past
due or
past due
≤ 30 daysPast
due
> 30 days
≤ 90 daysTOTAL
non
perfor-
mingUnlikely
to pay
that are
not past
due or are
past due
≤ 90 daysPast
due
> 90 days
≤ 180 daysPast due
> 180 days ≤ 1 yearPast
due
> 1 year
≤ 2 yearsPast
due
> 2 years
≤ 5 yearsPast
due
> 5 years
≤ 7 yearsPast
due
> 7 yearsof which
defaultedCash balances
at central banks and other demand deposits204,473
204,473
-
-
-
-
-
-
-
-
-
-
Loans and advances
543,930
543,055
874
16,491
12,017
477
612
1,185
1,319
316
565
16,491
Central banks
8,050
8,050
-
13
-
-
-
-
-
-
13
13
General governments
27,619
27,606
13
115
31
0
1
0
39
-
44
115
Credit institutions
14,681
14,680
0
22
19
-
-
-
-
-
3
22
Other financial corporations
44,887
44,886
0
131
32
2
0
-
98
-
-
131
Non-financial corporations
224,118
223,834
284
8,635
7,148
99
199
469
424
67
228
8,635
of which SMEs
47,592
47,490
102
3,778
2,910
69
152
204
219
52
172
3,778
Households
224,575
223,998
577
7,574
4,786
376
411
716
758
249
277
7,574
Debt securities
62,609
62,609
-
107
107
-
-
-
-
-
-
107
Central banks
2,955
2,955
-
-
-
-
-
-
-
-
-
-
General governments
44,001
44,001
-
8
8
-
-
-
-
-
-
8
Credit institutions
5,100
5,100
-
-
-
-
-
-
-
-
-
-
Other financial corporations
4,789
4,789
-
-
-
-
-
-
-
-
-
-
Non-financial corporations
5,763
5,763
-
99
99
-
-
-
-
-
-
99
Off-balance-
sheet exposures382,724
-
-
1,001
-
-
-
-
-
-
-
1,001
Central banks
241
-
-
General governments
6,275
0
0
Credit institutions
98,433
-
-
Other financial corporations
52,621
0
0
Non-financial corporations
207,858
904
904
Households
17,297
97
97
TOTAL
1,193,736
810,137
874
17,599
12,124
477
612
1,185
1,319
316
565
17,599
(In EURm)
31.12.2020
Performing exposures
Non-performing exposures
TOTAL
performingNot past
due or
past due
≤ 30 daysPast
due >
30
days ≤
90 daysTOTAL
non
perfor-
mingUnlikely
to pay
that are
not past
due or are
past due ≤
90 daysPast
due >
90
days ≤
180
daysPast
due >
180
days ≤
1 yearPast
due >
1 year
≤ 2 yearsPast
due > 2
years ≤
5 yearsPast
due > 5
years ≤ 7
yearsPast
due > 7
yearsof
which
defaultedLoans and advances
496,521
495,424
1,097
17,040
13,221
422
661
1,009
902
291
534
17,040
Central banks
8,771
8,771
-
13
-
-
-
-
-
-
13
13
General governments
26,829
26,815
14
137
45
2
0
12
37
-
43
137
Credit institutions
13,458
13,458
0
33
30
0
0
0
-
-
3
33
Other financial corporations
31,512
31,511
1
142
41
10
-
1
90
-
-
142
Non-financial corporations
205,332
204,865
468
8,731
7,339
137
304
318
314
70
249
8,731
of which SMEs
44,633
44,527
106
3,705
2,945
79
115
159
176
61
170
3,705
Households
210,618
210,004
614
7,984
5,766
274
356
679
462
221
227
7,984
Debt securities
67,504
67,504
-
121
121
-
-
-
-
-
-
121
Central banks
4,563
4,563
-
-
-
-
-
-
-
-
-
-
General governments
47,727
47,727
-
13
13
-
-
-
-
-
-
13
Credit institutions
6,397
6,397
-
-
-
-
-
-
-
-
-
-
Other financial corporations
4,778
4,778
-
-
-
-
-
-
-
-
-
-
Non-financial corporations
4,039
4,039
-
108
108
-
-
-
-
-
-
108
Off-balance-
sheet exposures336,234
1,160
-
-
1,160
Central banks
42
-
-
-
-
General governments
7,045
0
-
-
0
Credit institutions
75,742
0
-
-
0
Other financial corporations
58,682
12
-
-
12
Non-financial corporations
179,597
1,058
-
-
1,058
Households
15,126
89
89
TOTAL
900,259
562,928
1,097
18,321
13,342
422
661
1,009
902
291
534
18,321
(In EURm)
31.12.2021
Gross carrying/nominal amount
Accumulated
impairment
Provisions on
off-balance-sheet
commitments
and financial
guarantees
given
Accumulated
negative
changes in fair
value due to
credit risk on
non-performing
exposures
TOTAL
nominal
of which
non-performing
of which
subject to
impairment
TOTAL non
performing
of which
defaulted
On-balance sheet exposures
623,135
16,596
16,596
602,583
(11,260)
-
Europe
490,767
11,823
11,823
471,017
(7,779)
-
France
305,781
7,913
7,913
287,486
(4,968)
-
Czech Republic
41,272
667
667
41,272
(496)
-
Germany
22,659
501
501
22,528
(310)
-
Luxembourg
12,360
425
425
12,353
(67)
-
United Kingdom
27,049
374
374
26,053
(163)
-
Italy
16,742
713
713
16,742
(571)
-
Switzerland
5,454
47
47
5,452
(26)
-
Russian Federation
15,170
332
332
15,170
(438)
-
Romania
10,564
295
295
10,564
(406)
-
Spain
4,918
175
175
4,856
(108)
-
Other European countries:
EU and EFTA20,193
274
274
19,943
(179)
-
Other European countries
8,605
106
106
8,598
(48)
-
North America
58,068
164
164
58,068
(149)
-
United States
55,863
162
162
55,863
(146)
-
Other North American countries
2,206
2
2
2,205
(2)
-
Asia-Pacific
23,218
612
612
23,181
(384)
-
Japan
1,512
0
0
1,512
(1)
-
China
5,003
148
148
5,003
(90)
-
Other Asia-Pacific countries
16,703
464
464
16,666
(293)
-
Africa and Middle East
42,847
3,754
3,754
42,846
(2,850)
-
Morocco
10,684
1,647
1,647
10,684
(1,113)
-
Other Africa and
Middle East countries32,164
2,107
2,107
32,163
(1,736)
-
Latin America and Caribbean
8,236
243
243
7,471
(98)
-
Off-balance sheet exposures
383,725
1,001
1,001
(888)
Europe
274,851
696
696
(664)
France
176,038
481
481
(363)
Czech Republic
9,447
50
50
(43)
Germany
14,574
5
5
(34)
Luxembourg
9,634
1
1
(4)
United Kingdom
14,329
1
1
(17)
Italy
7,462
12
12
(17)
Switzerland
8,135
1
1
(2)
Russian Federation
4,696
7
7
(10)
Romania
2,165
43
43
(64)
Spain
7,663
70
70
(54)
Other European countries:
EU and EFTA18,935
22
22
(52)
Other European countries
1,774
1
1
(4)
North America
71,131
10
10
(72)
United States
68,712
10
10
(71)
Other North American countries
2,419
0
0
(1)
Asia-Pacific
22,423
48
48
(12)
Japan
6,725
-
-
(1)
China
3,382
-
-
(0)
Other Asia-Pacific countries
12,317
48
48
(11)
Africa and Middle East
11,857
247
247
(136)
Morocco
2,040
73
73
(42)
Other Africa and
Middle East countries9,817
174
174
(93)
Latin America and
the Caribbean3,463
0
0
(4)
TOTAL
1,006,860
17,597
17,597
602,583
(11,260)
(888)
-
(In EURm)
31.12.2020
Gross carrying/nominal amount
Accumulated
impairment
Provisions on
off-balance-sheet
commitments
and financial
guarantees
given
Accumulated
negative
changes in fair
value due to
credit risk on
non-performing
exposures
TOTAL
nominal
of which
non-performing
of which
subject to
impairment
TOTAL non
performing
of which
defaulted
On-balance sheet exposures
581,186
17,161
17,161
558,286
(11,870)
-
Europe
469,123
12,535
12,535
446,422
(8,614)
-
France
298,966
8,264
8,264
277,736
(5,885)
-
Czech Republic
37,480
643
643
37,480
(496)
-
Germany
24,610
560
560
24,552
(304)
-
Luxembourg
11,830
608
608
11,708
(52)
-
United Kingdom
20,460
398
398
19,974
(158)
-
Italy
16,126
642
642
16,126
(550)
-
Switzerland
4,877
91
91
4,850
(22)
-
Russian Federation
13,732
420
420
13,732
(473)
-
Romania
9,770
293
293
9,770
(410)
-
Spain
5,020
252
252
4,543
(97)
-
Other European countries:
EU and EFTA17,155
261
261
16,857
(118)
-
Other European countries
9,097
105
105
9,093
(50)
-
North America
45,376
420
420
45,219
(242)
-
United States
43,719
411
411
43,563
(232)
-
Other North American countries
1,657
9
9
1,657
(10)
-
Asia-Pacific
20,317
556
556
20,317
(404)
-
Japan
1,059
0
0
1,059
(17)
-
China
5,695
166
166
5,695
(14)
-
Other Asia-Pacific countries
13,563
390
390
13,563
(373)
-
Africa and Middle East
39,209
3,399
3,399
39,184
(2,577)
-
Morocco
10,116
1,275
1,275
10,116
(1,021)
-
Other Africa and
Middle East countries29,093
2,124
2,124
29,067
(1,556)
-
Latin America and Caribbean
7,161
250
250
7,144
(33)
-
Off-balance sheet exposures
337,393
1,160
1,160
(928)
Europe
234,089
819
819
(722)
France
153,048
561
561
(381)
Czech Republic
6,905
63
63
(49)
Germany
11,423
12
12
(32)
Luxembourg
8,544
0
0
(2)
United Kingdom
14,640
6
6
(12)
Italy
6,748
5
5
(14)
Switzerland
5,229
3
3
(10)
Russian Federation
4,210
1
1
(5)
Romania
1,803
53
53
(76)
Spain
5,160
77
77
(46)
Other European countries:
EU and EFTA14,786
34
34
(88)
Other European countries
1,593
5
5
(4)
North America
53,233
27
27
(80)
United States
50,911
27
27
(76)
Other North American countries
2,322
0
0
(4)
Asia-Pacific
36,135
71
71
(10)
Japan
24,860
-
-
(2)
China
2,597
7
7
(2)
Other Asia-Pacific countries
8,678
64
64
(6)
Africa and Middle East
9,562
242
242
(111)
Morocco
1,938
77
77
(39)
Other Africa and
Middle East countries7,623
165
165
(72)
Latin America and
the Caribbean4,375
0
0
(4)
TOTAL
918,579
18,321
18,321
558,286
(11,870)
(928)
-
The table below displays loans and advances to non-financial corporations, in accordance with EBA instructions (EBA/ITS/2020/04).
(In EURm)
31.12.2021
Gross carrying amount
Accumulated
impairment
Accumulated
negative
changes in fair
value due to
credit risk on
non-performing
exposures
TOTAL
nominal
of which non-performing
of which loans
and advances
subject to
impairment
TOTAL non
performant
of which
defaulted
Agriculture, forestry
and fishing1,907
125
125
1,841
(104)
-
Mining
and quarrying9,650
201
201
9,638
(102)
-
Manufacturing
30,649
1,638
1,638
30,110
(1,073)
-
Electricity, gas, steam and air conditioning supply
16,694
80
80
16,406
(83)
-
Water supply
2,159
23
23
1,778
(28)
-
Construction
7,152
805
805
6,956
(571)
-
Wholesale
and retail trade28,738
1,817
1,817
28,138
(1,364)
-
Transport
and storage21,479
592
592
21,142
(340)
-
Accommodation and food service activities
4,070
1,143
1,143
3,902
(432)
-
Information and communication
8,824
79
79
8,346
(89)
-
Financial and insurance actvities
19,817
280
280
18,552
(221)
-
Real estate activities
31,417
491
491
29,141
(372)
-
Professional, scientific and technical activities
6,798
213
213
6,611
(196)
-
Administrative
and support service activities8,262
360
360
8,145
(156)
-
Public administration
and defence, compulsory social security1,835
6
6
1,575
(4)
-
Education
359
24
24
349
(15)
-
Human health services and social work activities
1,501
63
63
1,461
(39)
-
Arts, entertainment
and recreation967
71
71
882
(51)
-
Other services
30,476
623
623
28,926
(411)
-
TOTAL
232,753
8,635
8,635
223,899
(5,651)
-
The table below indicates loans and advances to non-financial corporations, in accordance with EBA guidelines (EBA/GL/2018/10).
(In EURm)
31.12.2020
Gross carrying amount
Accumulated
impairmentTOTAL nominal
of which non-performing
of which loans and
advances subject to
impairmentTOTAL non
performantof which defaulted
Agriculture, forestry and fishing
1,773
103
103
1,695
(85)
Mining
and quarrying10,387
399
399
10,371
(188)
Manufacturing
29,673
1,699
1,699
28,914
(1,235)
Electricity, gas, steam and air conditioning supply
11,891
100
100
11,778
(96)
Water supply
2,126
28
28
1,729
(30)
Construction
7,388
724
724
6,796
(578)
Wholesale
and retail trade26,632
2,063
2,063
25,763
(1,432)
Transport
and storage18,338
519
519
17,769
(361)
Accommodation and food service activities
3,918
901
901
3,708
(376)
Information and communication
6,843
136
136
6,773
(110)
Financial and insurance actvities
18,348
283
283
16,867
(313)
Real estate activities
26,958
552
552
24,356
(336)
Professional, scientific and technical activities
6,572
262
262
6,217
(255)
Administrative
and support service activities6,160
291
291
6,000
(165)
Public administration and defence, compulsory social security
2,134
2
2
1,895
(2)
Education
319
24
24
312
(12)
Human health services and social work activities
1,550
82
82
1,489
(55)
Arts, entertainment
and recreation874
41
41
776
(59)
Other services
32,181
522
522
30,033
(512)
TOTAL
214,063
8,731
8,731
203,241
(6,201)
(In EURm)
31.12.2021
Collateral obtained by taking possession accumulated
Value at initial
recognition
Accumulated negative
changes
Property, plant and equipment (PP&E)
34
(14)
Other than PP&E
64
(29)
Residential immovable property
0
(0)
Commercial Immovable property
-
-
Movable property (auto, shipping, etc.)
-
-
Equity and debt instruments
-
-
Other
63
(29)
TOTAL
98
(44)
(In EURm)
31.12.2020
Collateral obtained by taking possession accumulated
Value at initial
recognition
Accumulated negative
changes
Property, plant and equipment (PP&E)
37
(8)
Other than PP&E
52
(17)
Residential immovable property
2
(0)
Commercial Immovable property
2
-
Movable property (auto, shipping, etc.)
-
-
Equity and debt instruments
-
-
Other
49
(16)
TOTAL
89
(24)
(In EURm)
31.12.2021
Exposures
unsecured –
Carrying amount
Exposures secured –
Carrying amount
of which secured by
collateral
of which secured by
financial guarantees
of which secured by
credit derivatives
Total loans
467,156
297,738
124,447
173,291
-
Total debt securities
56,063
6,654
6,561
93
TOTAL EXPOSURES
523,219
304,391
131,008
173,384
-
of which non-performing exposures
11,654
4,944
2,217
2,727
-
of which defaulted
11,654
4,944
2,217
2,727
-
(In EURm)
31.12.2020
Exposures
unsecured –
Carrying amount
Exposures secured –
Carrying amount
of which secured by
collateral
of which secured by
financial guarantees
of which secured by
credit derivatives
Total loans
442,980
262,058
104,775
157,282
-
Total debt securities
62,035
5,590
5,486
104
TOTAL EXPOSURES
505,014
267,648
110,262
157,386
-
of which non-performing exposures
12,921
4,240
1,975
2,265
-
of which defaulted
12,921
4,240
1,975
2,265
-
(In EURm)
31.12.2021
Gross carrying amount
Accumulated impairment, accumulated negative changes
in fair value due to credit risk
Gross
carrying
amount
TOTAL
Performing
Non-performing
TOTAL
Performing
Non-performing
Inflows to
non-
performing
exposures
TOTAL
performing
of which
exposures
with for-
bearance
measures
of which
Instru-
ments
with
significant
increase in
credit risk
since
initial
recogni-
tion but
not credit
impaired
(Stage 2)
TOTAL
non-
performing
of which
exposures
with for-
bearance
measures
of which
Unlikely
to pay
that are
not
past-due
or
past-due
<= 90
days
TOTAL
performing
of which
exposures
with for-
bearance
measures
of which
Instru-
ments
with
significant
increase in
credit risk
since
initial
recogni-
tion but
not credit
impaired
(Stage 2)
TOTAL
non-
performing
of which
exposures
with for-
bearance
measures
of which
Unlikely
to pay
that are
not
past-due
or
past-due
<= 90 days
Loans and advances subject to moratorium
0
0
-
0
-
-
-
(0)
(0)
-
(0)
-
-
-
-
of which
Households-
-
-
-
-
-
-
-
-
-
-
-
-
-
-
of which Collateralised
by residential immovable property-
-
-
-
-
-
-
-
-
-
-
-
-
-
-
of which Non-financial corporations
0
0
-
0
-
-
-
(0)
(0)
-
(0)
-
-
-
-
of which Small and Medium-sized Enterprises
0
0
-
0
-
-
-
(0)
(0)
-
(0)
-
-
-
-
of which Collateralised
by commercial immovable property-
-
-
-
-
-
-
-
-
-
-
-
-
-
-
(In EURm)
30.06.2021
Gross carrying amount
Accumulated impairment, accumulated negative changes
in fair value due to credit risk
Gross
carrying
amount
TOTAL
Performing
Non-performing
TOTAL
Performing
Non-performing
Inflows to
non-
performing
exposures
TOTAL
performing
of which
exposures
with for-
bearance
measures
of which
Instru-
ments
with
significant
increase in
credit risk
since
initial
recogni-
tion but
not credit
impaired
(Stage 2)
TOTAL
non-
performing
of which
exposures
with for-
bearance
measures
of which
Unlikely
to pay
that are
not
past-due
or
past-due
<= 90
days
TOTAL
performing
of which
exposures
with for-
bearance
measures
of which
Instru-
ments
with
significant
increase in
credit risk
since
initial
recogni-
tion but
not credit
impaired
(Stage 2)
TOTAL
non-
performing
of which
exposures
with for-
bearance
measures
of which
Unlikely
to pay
that are
not
past-due
or
past-due
<= 90 days
Loans and advances subject to moratorium
503
459
39
160
44
0
26
(48)
(24)
(5)
(16)
(24)
(0)
(7)
27
of which
Households19
19
-
13
1
-
0
(2)
(1)
-
(1)
(0)
-
(0)
0
of which Collateralised
by residential immovable property14
14
-
9
0
-
0
(1)
(1)
-
(1)
(0)
-
(0)
0
of which Non-financial corporations
483
440
39
148
43
0
26
(46)
(23)
(5)
(15)
(23)
(0)
(7)
26
of which Small and Medium-sized Enterprises
415
399
38
115
16
0
14
(22)
(19)
(5)
(12)
(2)
(0)
(2)
2
of which Collateralised
by commercial immovable property133
133
-
32
0
-
0
(2)
(1)
-
(1)
(0)
-
(0)
-
(In EURm)
31.12.2020
Gross carrying amount
Accumulated impairment, accumulated negative changes
in fair value due to credit risk
Gross
carrying
amount
TOTAL
Performing
Non-performing
TOTAL
Performing
Non-performing
Inflows to
non-
performing
exposures
TOTAL
performing
of which
exposures
with for-
bearance
measures
of which
Instru-
ments
with
significant
increase in
credit risk
since
initial
recogni-
tion but
not credit
impaired
(Stage 2)
TOTAL
non-
performing
of which
exposures
with for-
bearance
measures
of which
Unlikely
to pay
that are
not
past-due
or
past-due
<= 90
days
TOTAL
performing
of which
exposures
with for-
bearance
measures
of which
Instru-
ments
with
significant
increase in
credit risk
since
initial
recogni-
tion but
not credit
impaired
(Stage 2)
TOTAL
non-
performing
of which
exposures
with for-
bearance
measures
of which
Unlikely
to pay
that are
not
past-due
or
past-due
<= 90 days
Loans and advances subject to moratorium
4,606
4,553
34
2,028
53
3
26
(76)
(69)
(4)
(54)
(8)
(0)
(3)
33
of which
Households525
508
-
110
17
1
10
(3)
(1)
(0)
(1)
(2)
(0)
(1)
10
of which Collateralised
by residential immovable property485
469
-
99
16
-
10
(3)
(1)
(0)
(1)
(2)
(0)
(1)
9
of which Non-financial corporations
4,080
4,045
34
1,918
35
2
16
(73)
(67)
(4)
(53)
(6)
(0)
(2)
24
of which Small and Medium-sized Enterprises
1,818
1,792
34
420
26
2
10
(54)
(50)
(4)
(38)
(4)
(0)
(1)
20
of which Collateralised
by commercial immovable property982
972
-
125
9
-
4
(5)
(4)
-
(4)
(1)
-
(0)
6
(In EURm)
31.12.2021
Number
of obligors
Gross carrying amount
TOTAL
of which
legislative
moratoria
of which
expired
Residual maturity of moratoria
<= 3 months
> 3 months
<= 6 months
> 6 months
<= 9 months
> 9 months
<= 12 months
> 1 year
Loans and advances for which moratorium
was offered433,443
25,777
Loans and advances subject to moratorium (granted)
408,620
24,910
3,052
24,910
0
-
-
-
-
of which Households
4,596
1,362
4,596
-
-
-
-
-
of which Collateralised by residential immovable property
3,409
1,126
3,409
-
-
-
-
-
of which Non-financial corporations
20,300
1,689
20,300
0
-
-
-
-
of which
Small and Medium-sized Enterprises12,598
1,413
12,598
0
-
-
-
-
of which Collateralised by commercial
immovable property2,670
1,117
2,670
-
-
-
-
-
Societe Generale group has granted moratoria to its clients on their loans and advances in order to support them during the Covid-19 crisis.
As at 31 December 2021, the exposure of the Group related to loans having been subject to moratoria(1) amounts to EUR 24.9 billion, fully expired. These moratoria have been granted to households, comprised of professionals as well as of individuals, up to EUR 4.6 billion and to non-financial corporations up to EUR 20.3 billion.
(In EURm)
30.06.2021
Number
of obligors
Gross carrying amount
TOTAL
of which
legislative
moratoria
of which
expired
Residual maturity of moratoria
<= 3 months
> 3 months
<= 6 months
> 6 months
<= 9 months
> 9 months
<= 12 months
> 1 year
Loans and advances for which moratorium
was offered441,322
29,332
Loans and advances subject to moratorium (granted)
416,479
28,489
3,689
27,986
188
314
1
0
0
of which Households
4,971
1,491
4,952
16
3
0
0
0
of which Collateralised by residential immovable property
3,644
1,205
3,630
12
2
0
0
0
of which Non-financial corporations
23,500
2,196
23,017
172
311
0
0
0
of which Small and Medium-sized Enterprises
14,943
1,838
14,528
121
294
0
0
0
of which Collateralised by commercial
immovable property2,928
1,293
2,795
1
132
-
-
-
(1)In accordance with EBA guidelines on legislative and non-legislative moratoria on loan repayments applied due to the Covid-19 pandemic.
(In EURm)
31.12.2020
Number
of obligorsGross carrying amount
TOTAL
of which:
legislative
moratoriaof which:
expiredResidual maturity of moratoria
<= 3 months
> 3 months <= 6
months> 6 months
<= 9 months
> 9 months
<= 12 months
> 1 year
Loans and advances for which moratorium was offered
443,017
33,831
Loans and advances subject to moratorium (granted)
418,533
32,930
3,996
28,324
2,494
1,921
133
22
36
of which: Households
5,978
1,611
5,453
207
275
33
2
7
of which: Collateralised by residential immovable property
4,464
1,269
3,978
168
275
33
2
7
of which: Non-financial corporations
26,936
2,383
22,856
2,286
1,646
99
21
28
of which: Small and Medium-sized Enterprises
17,022
1,964
15,204
337
1,405
57
8
10
of which: Collateralised by commercial
immovable property3,162
1,346
2,180
165
796
19
-
-
(In EURm)
31.12.2021
Gross carrying amount
Maximum amount
of the guarantee
that can be considered
Gross carrying amount
TOTAL
of which forborne
Public guarantees received
Inflows to non
performing exposures
Newly originated loans and advances subject to public guarantee schemes
16,439
119
13,358
320
of which Households
4,177
27
of which Collateralised by residential immovable property
1
-
of which Non-financial corporations
12,243
119
9,226
293
of which Small and Medium-sized Enterprises
5,927
79
of which Collateralised by commercial immovable property
67
-
As at 31 December 2021, EUR 16.4 billion of loans secured by public guarantee mechanisms have been granted by Societe Generale group to its clients. The amount of guarantees associated with these loans amounts to EUR 13.4 billion.
(In EURm)
30.06.2021
Gross carrying amount
Maximum amount
of the guarantee
that can be considered
Gross carrying amount
TOTAL
of which forborne
Public guarantees received
Inflows to non
performing exposures
Newly originated loans and advances subject to public guarantee schemes
17,420
-
14,740
184
of which Households
4,331
28
of which Collateralised by residential immovable property
-
-
of which Non-financial corporations
13,071
-
10,925
156
of which Small and Medium-sized Enterprises
6,119
81
of which Collateralised by commercial immovable property
-
-
(In EURm)
31.12.2020
Gross carrying amount
Maximum amount of the
guarantee that can be
consideredGross carrying amount
TOTAL
of which: forborne
Public guarantees received
Inflows to non
performing
exposuresNewly originated loans and advances subject to public guarantee schemes
18,108
-
16,259
266
of which: Households
4,346
43
of which: Collateralised by residential immovable property
6
-
of which: Non-financial corporations
13,761
-
12,349
222
of which: Small and Medium-sized Enterprises
6,136
67
of which: Collateralised by commercial immovable property
-
-
-
6.6 ADDITIONAL QUANTITATIVE INFORMATION ON CREDIT RISK
■Exposure: defined as all assets (e.g. loans, receivables, accruals, etc.) associated with market or customer transactions, recorded on- and off-balance sheet;
■EAD (Exposure At Default) is defined as the bank’s exposure (on- and off-balance sheet) in the event of a counterparty’s default. Unless otherwise specifically indicated to the contrary, the EAD is reported post-CRM (Credit Risk Mitigation), after factoring in guarantees and collateral. Under the Standardised approach, EADs are presented net of specific provisions and financial collateral;
■Risk-Weighted Assets (RWA): are computed from the exposures and the associated level of risk, which depends on the debtors’ credit quality;
■Expected Loss (EL): potential loss incurred, given the quality of the structuring of a transaction and any risk mitigation measures such as collateral. Under the AIRB method, the following equation summarises the relation between these variables: EL = EAD x PD x LGD (except for defaulted exposures).
(In EURm)
31.12.2021
IRB approach
Standardised approach
Total
Exposure classes
Exposure
EAD
RWA
Exposure
EAD
RWA
Exposure
EAD
RWA
Sovereign
244,975
265,460
6,755
8,494
10,511
1,753
253,469
275,971
8,508
Institutions
47,421
39,906
4,523
6,152
20,627
4,867
53,573
60,533
9,389
Corporates
378,223
245,456
103,947
51,311
32,935
31,516
429,534
278,392
135,463
Retail
177,329
177,250
30,629
39,624
33,015
21,510
216,954
210,266
52,139
Others
48,312
47,690
27,893
82,859
61,566
43,986
131,171
109,256
71,879
TOTAL
896,261
775,763
173,747
188,440
158,655
103,632
1,084,701
934,418
277,379
The table as at 31 December 2020 has been modified as follows in order to reallocate exposures relating to deferred tax assets from “Sovereign” to “Others” exposure class, and also in order to associate with this same class the initial exposure relating to real estate loans towards retail customers secured by Crédit Logement institution:
(In EURm)
31.12.2020
IRB approach
Standardised approach
Total
Exposure classes
Exposure
EAD
RWA
Exposure
EAD
RWA
Exposure
EAD
RWA
Sovereign
238,278
259,525
6,035
7,182
9,093
1,211
245,460
268,619
7,246
Institutions
50,071
42,174
4,260
14,400
20,213
3,267
64,472
62,386
7,526
Corporates
336,718
218,170
97,642
47,472
30,320
27,815
384,190
248,490
125,456
Retail
173,480
171,042
32,667
36,589
30,688
20,413
220,969
201,730
53,081
Others
41,646
41,345
27,241
69,994
54,781
40,367
100,740
96,126
67,607
TOTAL
840,192
732,255
167,845
175,638
145,095
93,072
1,015,831
877,351
260,917
The credit conversion factor (CCF) is the ratio between the current undrawn part of a credit line which could be drawn and would therefore be exposed in the event of default and the undrawn part of this credit line. The significance of the credit line depends on the authorised limit, unless the unauthorised limit is greater.
The concept of “credit risk mitigation” (CRM) is a technique used by an institution to reduce the credit risk associated with its exposures.
In accordance with EBA instructions (EBA/ITS/2020/04), the amounts are presented without securitisation and contributions to default funds of central counterparties.
(In EURm)
31.12.2021
Exposures before CCF and CRM
Exposures post-CCF and CRM
RWA and RWA density
Exposure classes
On-balance
sheet
exposuresOff-balance
sheet
exposuresOn-balance
sheet
exposuresOff-balance
sheet
exposuresRWA
RWA
density
(%)Central governments or central banks
7,153
37
8,992
69
1,710
19%
Regional government or local authorities
633
137
895
74
265
27%
Public sector entities
255
15
227
0
130
57%
Multilateral development banks
1,285
17
1,450
1
43
3%
International organisations
-
-
-
-
-
-
Institutions
3,982
1,114
18,760
671
4,472
23%
Corporates
39,775
11,189
29,704
3,232
31,516
96%
Retail
32,513
6,690
31,331
1,684
21,510
65%
Secured by mortgages on immovable property
31,868
1,588
16,715
165
7,357
44%
Exposures in defaul
2,753
322
2,391
191
2,881
112%
Higher-risk categories
210
82
162
36
297
150%
Covered bonds
197
-
197
-
20
10%
Institutions and corporates
with a short term credit assessment-
-
-
-
-
-
Collective investment undertakings
13
-
13
-
84
656%
Equity
1,195
-
1,195
-
884
74%
Other items
32,352
4,696
32,352
4,688
32,154
87%
TOTAL
154,185
25,888
144,385
10,811
103,323
67%
The table as at 31 December 2020 has been modified as follows in order to reallocate exposures relating to deferred tax assets from “Central governments or central banks” to “Other items” exposure class, and also in order to associate with the “Secured by mortgages on immovable property” class the initial exposure relating to real estate loans towards retail customers secured by Crédit Logement institution:
(In EURm)
31.12.2020
Exposures before CCF and CRM
Exposures post-CCF and CRM
RWA and RWA density
Exposure classes
On-balance
sheet
exposuresOff-balance
sheet
exposuresOn-balance
sheet
exposuresOff-balance
sheet
exposuresRWA
RWA
density
(%)Central governments or central banks
5,791
35
7,586
28
1,178
15%
Regional government or local authorities
497
73
731
49
193
25%
Public sector entities
272
18
262
2
71
27%
Multilateral development banks
1,339
16
1,478
1
33
2%
International organisations
-
-
-
-
-
Institutions
8,806
4,719
18,710
459
3,002
16%
Corporates
36,371
10,759
27,470
2,850
27,815
92%
Retail
30,611
5,633
29,248
1,440
20,413
67%
Secured by mortgages on immovable property
24,949
1,224
14,891
152
6,645
44%
Exposures in defaul
2,861
179
2,814
77
3,057
106%
Higher-risk categories
295
186
294
75
553
150%
Covered bonds
206
-
206
-
21
10%
Institutions and corporates
with a short term credit assessment-
-
-
-
-
Collective investment undertakings
5
-
5
-
5
100%
Equity
974
-
974
-
706
72%
Other items
31,713
-
31,713
-
29,078
92%
TOTAL
144,692
22,841
136,382
5,134
92,771
66%
In accordance with EBA instructions (EBA/ITS/2020/04), the amounts are presented without securitisation and contributions to default funds of central counterparties.
(In EURm)
31.12.2021
Risk Weight
Exposure classes
0%
2%
4%
10%
20%
35%
50%
70%
75%
100%
150%
250%
370%
1,250%
Other
Risk
WeightTotal
of
which
unratedCentral governments or central banks
7,353
-
-
-
2
-
-
-
-
1,698
7
-
-
-
-
9,060
2,456
Regional governments or local authorities
174
-
-
-
652
-
1
-
-
140
-
-
-
-
2
969
546
Public sector entities
0
-
-
-
121
-
0
-
-
105
-
-
-
-
0
227
203
Multilateral Development Banks
1,408
-
-
-
-
-
-
-
-
43
-
-
-
-
-
1,451
66
International Organisations
-
-
-
-
-
-
-
-
-
-
-
-
-
-
-
-
-
Institutions
328
-
-
-
17,985
-
461
-
-
657
0
-
-
-
0
19,431
1,039
Corporates
-
-
-
-
1,498
-
782
-
35
30,213
392
-
-
-
15
32,935
26,349
Retail
-
-
-
-
-
1,714
-
-
31,089
176
-
-
-
-
37
33,015
32,202
Secured by
mortgages on immovable property-
-
-
-
-
11,663
1,818
-
3,156
238
-
-
-
-
6
16,880
15,731
Exposures
in default-
-
-
-
-
-
-
-
-
1,838
673
-
-
-
72
2,582
2,448
Items associated with
particularly high risk-
-
-
-
-
-
-
-
-
-
198
-
-
-
-
198
181
Covered bonds
-
-
-
197
-
-
-
-
-
-
-
-
-
-
-
197
-
Claims on institutions and corporates with a short-term credit assessment
-
-
-
-
-
-
-
-
-
-
-
-
-
-
-
-
-
Collective investments undertakings (CIU)
-
-
-
-
-
-
-
-
-
1
-
-
-
6
5
13
13
Equity exposures
27
-
-
-
-
-
-
-
-
851
-
7
-
-
309
1,195
1,195
Other exposures
1,537
-
-
1
443
-
3,567
-
-
19,842
-
2,487
-
-
9,163
37,041
35,270
TOTAL
10,827
-
-
198
20,701
13,376
6,628
-
34,280
55,804
1,270
2,494
-
6
9,610
155,195
117,700
The table as at 31 December 2020 has been modified as follows in order to reallocate exposures relating to deferred tax assets from “Central governments or central banks” to “Other exposures” exposure class:
(In EURm)
31.12.2020
Risk Weight
Exposure classes
0%
2%
4%
10%
20%
35%
50%
70%
75%
100%
150%
250%
370%
1,250%
Other
Risk
WeightTotal
of
which
unratedCentral governments or central banks
6,434
-
2
-
-
-
-
-
-
1,178
-
-
-
-
-
7,614
2,334
Regional governments or local authorities
94
-
-
-
615
-
1
-
-
70
-
-
-
-
0
780
487
Public sector entities
0
-
-
-
240
-
-
-
-
23
-
-
-
-
0
263
230
Multilateral Development Banks
1,436
-
-
-
-
-
20
-
-
23
-
-
-
-
-
1,479
46
International Organisations
-
-
-
-
-
-
-
-
-
-
-
-
-
-
-
-
-
Institutions
5,053
1,617
17
-
11,750
-
203
-
-
505
0
-
-
-
22
19,169
7,313
Corporates
-
-
-
-
920
-
813
-
4
28,331
245
-
-
-
8
30,320
24,586
Retail
-
-
-
-
0
1,777
-
-
28,659
132
-
-
-
-
119
30,688
30,688
Secured by
mortgages on immovable property0
-
-
-
-
10,258
1,649
-
2,879
251
-
-
-
-
7
15,043
13,840
Exposures
in default-
-
-
-
-
-
-
-
-
1,810
702
-
-
-
379
2,891
2,769
Items associated with
particularly high risk-
-
-
-
-
-
-
-
-
-
369
-
-
-
-
369
318
Covered bonds
-
-
-
206
-
-
-
-
-
-
-
-
-
-
-
206
-
Claims on institutions and corporates with a short-term credit assessment
-
-
-
-
-
-
-
-
-
-
-
-
-
-
-
-
-
Collective investments undertakings (CIU)
-
-
-
-
-
-
-
-
-
5
-
-
-
-
-
5
5
Equity exposures
3
-
-
-
-
-
-
-
-
668
-
10
-
-
293
974
974
Other exposures
1,914
-
-
-
456
-
2,776
-
-
17,284
0
2,702
-
-
6,581
31,713
30,101
TOTAL
14,936
1,617
19
206
13,982
12,035
5,462
-
31,542
50,279
1,316
2,712
-
-
7,409
141,516
113,690
The table below pesents Group exposures subject to credit risk and for which an internal model is used with a view to calculating RWA.
The relationship between PD buckets and Investment grade/Non-Investment grade status can be found in table 38.
(In EURm)
31.12.2021
PD scale
Original
on-
balance
sheet gross
exposure
Off-
balance
sheet
exposures
pre CCF
Average
CCF
EAD post
CRM and
post-CCF
Average
PD
Number
of
obligors
Average
LGD
Average
maturity
RWA
RWA
density
EL
Value
adjust-
ments
and
Provi-
sions
Central governments
and central banks0.00 to < 0.15
228,423
1,723
87%
230,603
0.01%
363
1.91%
1
1,351
0.59%
2
0.00 to < 0.10
223,428
1,722
87%
225,187
0.01%
355
1.55%
1
568
0.25%
1
0.10 to < 0.15
4,996
1
34%
5,416
0.13%
8
16.82%
3
783
14.46%
1
0.15 to < 0.25
-
-
-
118
-
-
-
2
-
-
-
0.25 to < 0.50
1,575
2
100%
2,828
0.26%
11
13.55%
3
384
13.60%
1
0.50 to < 0.75
2,266
118
100%
5,951
0.50%
9
10.88%
3
1,017
17.10%
26
0.75 to < 2.50
3,007
508
100%
8,331
1.55%
10
10.11%
3
1,484
17.82%
8
0.75 to < 1.75
2,268
7
100%
4,635
1.10%
5
11.70%
3
1,062
22.92%
5
1.75 to < 2.50
739
502
100%
3,696
2.12%
5
8.11%
3
422
11.42%
3
2.50 to < 10.00
3,560
2,164
92%
10,770
4.98%
50
4.44%
3
1,395
12.95%
9
2.50 to < 5.00
2,632
1,927
91%
7,997
4.01%
38
3.65%
3
1,142
14.28%
7
5.00 to < 10.00
928
236
100%
2,773
7.76%
12
6.70%
3
253
9.12%
2
10.00 to < 100.00
1,095
405
91%
5,853
16.32%
19
5.63%
3
998
17.06%
21
10.00 to < 20.00
1,092
405
91%
2,888
12.55%
17
7.38%
3
834
28.87%
21
20.00 to < 30.00
2
-
-
2,896
20.46%
2
4.02%
4
165
5.69%
1
30.00 to < 100.00
-
-
-
69
-
-
-
3
-
-
-
100.00 (default)
110
0
100%
973
100.00%
9
8.59%
3
122
12.55%
71
Subtotal
240,036
4,920
91%
265,428
1.00%
471
2.70%
1
6,752
2.54%
138
(105)
Institutions
0.00 to < 0.15
29,144
9,564
62%
33,938
0.04%
2,526
23.48%
2
1,981
5.84%
3
0.00 to < 0.10
26,896
9,148
61%
31,039
0.03%
2,130
24.46%
2
1,723
5.55%
2
0.10 to < 0.15
2,248
416
82%
2,898
0.13%
396
13.00%
3
257
8.87%
0
0.15 to < 0.25
-
-
-
1
-
-
5.10%
5
0
2.49%
0
0.25 to < 0.50
752
649
67%
1,329
0.26%
372
23.61%
2
301
22.65%
1
0.50 to < 0.75
2,254
932
67%
1,248
0.50%
163
24.24%
2
419
33.57%
1
0.75 to < 2.50
708
514
67%
1,352
1.54%
110
26.72%
2
724
53.54%
4
0.75 to < 1.75
363
224
50%
766
1.10%
58
25.78%
2
406
53.01%
1
1.75 to < 2.50
345
290
80%
585
2.12%
52
27.94%
2
318
54.24%
3
2.50 to < 10.00
1,707
483
34%
1,324
4.66%
293
17.94%
2
681
51.44%
9
2.50 to < 5.00
951
286
38%
1,076
3.94%
261
15.12%
2
450
41.85%
4
5.00 to < 10.00
756
197
28%
248
7.76%
32
30.16%
1
231
92.99%
5
10.00 to < 100.00
513
171
35%
544
14.59%
73
22.70%
1
350
64.34%
10
10.00 to < 20.00
461
97
25%
447
13.21%
42
19.26%
1
182
40.72%
4
20.00 to < 30.00
52
74
49%
96
21.19%
31
38.47%
2
168
174.76%
6
30.00 to < 100.00
-
-
-
1
-
-
45.00%
2
0
9.76%
0
100.00 (default)
30
-
-
170
100.00%
14
13.75%
4
67
39.47%
10
Subtotal
35,107
12,313
61%
39,906
0.89%
3,551
23.38%
2
4,523
11.33%
38
(50)
Corporate – SME
0.00 to < 0.15
1,084
534
71%
1,338
0.10%
3,171
31.48%
3
238
17.78%
0
0.00 to < 0.10
408
198
93%
563
0.05%
932
25.11%
3
67
11.87%
0
0.10 to < 0.15
676
336
58%
775
0.13%
2,239
36.10%
3
171
22.08%
0
0.15 to < 0.25
4,108
710
89%
4,618
0.20%
1,280
13.16%
1
351
7.61%
1
0.25 to < 0.50
930
770
64%
1,102
0.30%
7,754
55.80%
3
560
50.82%
2
0.50 to < 0.75
3,057
1,537
60%
3,234
0.53%
6,319
34.93%
3
1,383
42.77%
6
0.75 to < 2.50
10,320
2,139
66%
10,052
1.53%
15,710
28.86%
4
5,428
54.00%
45
0.75 to < 1.75
6,730
1,170
67%
6,579
1.18%
9,450
27.42%
4
3,289
49.99%
21
1.75 to < 2.50
3,590
968
63%
3,473
2.19%
6,260
31.60%
3
2,139
61.59%
24
2.50 to < 10.00
9,489
1,406
72%
8,073
4.58%
20,435
32.84%
3
6,431
79.65%
119
2.50 to < 5.00
7,397
1,185
73%
6,450
3.78%
15,032
33.29%
3
5,083
78.81%
80
5.00 to < 10.00
2,092
220
69%
1,623
7.74%
5,403
31.06%
3
1,347
83.02%
39
10.00 to < 100.00
2,613
230
63%
1,881
17.41%
6,935
32.15%
3
2,084
110.78%
104
10.00 to < 20.00
1,767
134
62%
1,274
13.19%
4,426
31.93%
3
1,331
104.44%
54
20.00 to < 30.00
729
84
65%
544
25.41%
2,084
31.57%
2
652
119.81%
42
30.00 to < 100.00
116
13
62%
63
33.55%
425
41.50%
2
102
160.50%
9
100.00 (default)
1,745
209
52%
1,601
100.00%
5,282
47.75%
2
2,280
142.44%
801
Subtotal
33,345
7,535
68%
31,900
7.78%
66,886
30.39%
3
18,755
58.79%
1,079
(1,167)
Corporate – Specialised lending
0.00 to < 0.15
6,324
5,103
51%
8,565
0.31%
750
19.63%
2
955
11.16%
2
0.00 to < 0.10
2,996
2,312
49%
4,046
0.05%
656
21.26%
3
455
11.25%
0
0.10 to < 0.15
3,328
2,792
53%
4,518
0.55%
94
18.17%
2
500
11.07%
1
0.15 to < 0.25
-
-
-
-
-
-
-
-
-
-
-
0.25 to < 0.50
5,645
3,416
42%
6,372
0.27%
164
15.76%
2
1,037
16.27%
3
0.50 to < 0.75
10,840
3,450
48%
11,275
0.53%
369
12.76%
4
2,675
23.73%
9
0.75 to < 2.50
15,734
8,056
45%
16,954
1.61%
971
13.01%
3
5,626
33.18%
38
0.75 to < 1.75
8,799
5,060
46%
9,427
1.15%
469
12.85%
3
3,121
33.11%
16
1.75 to < 2.50
6,935
2,997
44%
7,527
2.18%
502
13.22%
3
2,505
33.28%
22
2.50 to < 10.00
8,960
3,841
48%
8,874
4.32%
744
16.25%
3
3,739
42.13%
44
2.50 to < 5.00
7,212
3,097
47%
7,527
3.82%
632
15.15%
3
3,183
42.29%
34
5.00 to < 10.00
1,748
744
52%
1,347
7.11%
112
22.41%
2
556
41.28%
11
10.00 to < 100.00
1,322
403
76%
1,358
16.57%
115
15.10%
3
959
70.64%
31
10.00 to < 20.00
731
115
63%
782
12.09%
75
15.64%
3
624
79.84%
18
20.00 to < 30.00
591
288
81%
576
22.66%
40
14.36%
3
335
58.14%
14
30.00 to < 100.00
-
-
-
-
-
-
-
-
-
-
-
100.00 (default)
1,321
70
80%
1,119
100.00%
89
56.43%
2
612
54.69%
563
Subtotal
50,146
24,340
47%
54,516
3.86%
3,202
15.79%
3
15,604
28.62%
689
(758)
Corporate – Other
0.00 to < 0.15
31,928
87,658
47%
66,826
0.07%
4,424
32.30%
2
10,440
15.62%
14
0.00 to < 0.10
21,039
61,535
48%
46,196
0.04%
2,969
33.22%
2
5,745
12.44%
6
0.10 to < 0.15
10,889
26,123
43%
20,630
0.13%
1,455
30.23%
2
4,695
22.76%
8
0.15 to < 0.25
46
24
64%
51
0.17%
88
35.19%
2
14
28.01%
0
0.25 to < 0.50
12,076
22,129
44%
19,988
0.26%
1,655
29.94%
3
6,805
34.05%
15
0.50 to < 0.75
11,704
16,137
45%
17,577
0.50%
2,633
29.16%
2
7,872
44.79%
24
0.75 to < 2.50
17,961
15,747
44%
21,646
1.58%
5,775
33.01%
2
13,524
62.48%
86
0.75 to < 1.75
8,843
9,230
45%
11,708
1.11%
3,190
29.82%
2
6,741
57.58%
34
1.75 to < 2.50
9,118
6,517
43%
9,939
2.14%
2,585
36.76%
2
6,783
68.25%
52
2.50 to < 10.00
17,208
10,312
54%
20,077
4.52%
9,323
30.45%
2
19,149
95.38%
227
2.50 to < 5.00
14,432
8,514
51%
16,291
3.75%
7,404
29.98%
2
15,420
94.66%
160
5.00 to < 10.00
2,775
1,798
66%
3,786
7.83%
1,919
32.46%
2
3,729
98.50%
68
10.00 to < 100.00
5,980
2,594
61%
3,685
15.24%
2,572
31.15%
2
4,865
132.01%
155
10.00 to < 20.00
2,997
1,057
71%
2,620
12.64%
1,650
32.33%
2
3,410
130.18%
92
20.00 to < 30.00
2,954
1,533
54%
1,045
21.41%
870
28.10%
2
1,421
135.96%
61
30.00 to < 100.00
29
3
88%
20
33.99%
52
35.60%
3
33
166.71%
2
100.00 (default)
2,521
429
60%
2,207
100.00%
1,369
49.44%
2
2,048
92.80%
1,156
Subtotal
99,424
155,028
47%
152,058
2.77%
27,839
31.71%
2
64,718
42.56%
1,678
(1,977)
Retail – Secured by real estate SME
0.00 to < 0.15
17
2
100%
19
0.04%
15,671
13.97%
0
1.47%
0
0.00 to < 0.10
17
2
100%
19
0.04%
15,671
13.97%
0
1.47%
0
0.10 to < 0.15
-
-
-
-
-
-
-
-
-
-
0.15 to < 0.25
1
-
-
1
0.24%
13
13.39%
0
4.88%
0
0.25 to < 0.50
816
9
100%
825
0.27%
4,713
16.19%
54
6.56%
0
0.50 to < 0.75
1,748
26
100%
1,774
0.62%
32
9.87%
122
6.87%
1
0.75 to < 2.50
2,139
28
100%
2,167
1.04%
12,056
15.04%
330
15.24%
3
0.75 to < 1.75
2,138
28
100%
2,166
1.04%
9,511
15.05%
330
15.25%
3
1.75 to < 2.50
1
-
-
1
2.14%
2,545
5.34%
0
8.78%
0
2.50 to < 10.00
530
9
100%
539
2.83%
211
15.62%
161
29.91%
2
2.50 to < 5.00
498
9
100%
506
2.57%
11
15.58%
145
28.57%
2
5.00 to < 10.00
33
0
100%
33
6.90%
200
16.22%
17
50.62%
0
10.00 to < 100.00
200
3
100%
203
15.46%
649
10.45%
90
44.12%
3
10.00 to < 20.00
188
3
100%
191
14.72%
576
10.08%
80
42.04%
3
20.00 to < 30.00
12
0
100%
12
26.83%
73
16.19%
9
76.27%
1
30.00 to < 100.00
-
-
-
-
-
-
-
-
-
-
100.00 (default)
138
0
100%
135
100.00%
601
31.90%
171
126.45%
35
Subtotal
5,590
76
100%
5,663
3.85%
33,946
13.88%
929
16.40%
45
(39)
Retail –
Secured by
real estate non-SME0.00 to < 0.15
31,049
1,004
100%
32,049
0.07%
595,987
13.99%
824
2.57%
3
0.00 to < 0.10
31,049
1,004
100%
32,049
0.07%
541,050
13.99%
824
2.57%
3
0.10 to < 0.15
0
0
100%
0
0.18%
54,937
20.38%
0
8.01%
0
0.15 to < 0.25
27,828
867
100%
28,534
0.22%
32,754
14.51%
1,855
6.50%
9
0.25 to < 0.50
8,769
487
100%
9,045
0.41%
8,769
17.90%
1,162
12.84%
7
0.50 to < 0.75
14,045
732
100%
14,568
0.62%
122,814
10.78%
1,471
10.10%
10
0.75 to < 2.50
15,635
680
100%
16,162
1.60%
70,440
11.62%
2,924
18.10%
25
0.75 to < 1.75
7,108
464
100%
7,440
1.03%
61,072
17.91%
1,788
24.03%
14
1.75 to < 2.50
8,527
217
100%
8,722
2.08%
9,368
6.26%
1,137
13.03%
11
2.50 to < 10.00
6,151
195
100%
6,320
4.95%
31,327
12.43%
2,540
40.19%
36
2.50 to < 5.00
3,308
133
100%
3,419
3.27%
24,534
15.49%
1,473
43.07%
17
5.00 to < 10.00
2,843
62
100%
2,901
6.94%
6,793
8.82%
1,068
36.80%
19
10.00 to < 100.00
983
24
100%
1,004
17.80%
4,522
9.33%
532
53.00%
18
10.00 to < 20.00
848
22
100%
869
16.06%
1,741
8.93%
439
50.56%
13
20.00 to < 30.00
109
2
100%
109
24.48%
992
10.35%
67
61.89%
3
30.00 to < 100.00
27
0
100%
27
47.07%
1,789
18.15%
26
96.33%
2
100.00 (default)
951
3
100%
928
100.00%
7,329
27.89%
841
90.64%
212
Subtotal
105,411
3,991
100%
108,611
1.74%
873,942
13.65%
12,150
11.19%
319
(293)
Retail – Qualifying revolving
0.00 to < 0.15
85
1,139
64%
1,714
0.08%
1,646,029
52.25%
47
2.72%
1
0.00 to < 0.10
17
122
75%
1,250
0.07%
1,476,350
56.69%
33
2.66%
0
0.10 to < 0.15
68
1,017
63%
463
0.11%
169,679
40.28%
13
2.87%
0
0.15 to < 0.25
-
232
64%
92
0.24%
234,758
34.27%
4
4.42%
0
0.25 to < 0.50
95
187
65%
785
0.45%
177,713
54.71%
94
11.97%
2
0.50 to < 0.75
100
505
56%
285
0.60%
1,454,219
35.64%
28
9.83%
1
0.75 to < 2.50
323
407
57%
799
1.38%
1,143,085
45.57%
180
22.56%
5
0.75 to < 1.75
125
220
63%
533
1.13%
975,328
50.82%
119
22.36%
3
1.75 to < 2.50
199
186
50%
266
1.89%
167,757
35.05%
61
22.94%
2
2.50 to < 10.00
613
215
59%
1,042
4.91%
1,548,019
46.91%
600
57.56%
24
2.50 to < 5.00
280
142
58%
538
3.20%
855,015
46.16%
231
43.00%
8
5.00 to < 10.00
333
73
62%
504
6.73%
693,004
47.71%
368
73.09%
16
10.00 to < 100.00
351
22
65%
407
21.92%
549,476
44.17%
463
113.70%
38
10.00 to < 20.00
230
19
63%
273
14.32%
175,133
45.95%
297
108.76%
18
20.00 to < 30.00
28
2
72%
29
25.14%
192,314
38.55%
33
114.51%
3
30.00 to < 100.00
93
1
77%
105
40.80%
182,029
41.09%
133
126.35%
17
100.00 (default)
277
4
22%
273
100.00%
158,751
60.30%
126
46.16%
178
Subtotal
1,844
2,710
61%
5,398
8.00%
6,912,050
49.20%
1,542
28.57%
248
(226)
Retail –
Other SME0.00 to < 0.15
89
2
100%
90
0.07%
484
14.45%
2
2.59%
0
0.00 to < 0.10
81
2
100%
83
0.06%
271
11.75%
2
1.85%
0
0.10 to < 0.15
8
-
-
8
0.13%
213
43.82%
1
10.61%
0
0.15 to < 0.25
16
11
99%
28
0.23%
299
30.63%
3
10.87%
0
0.25 to < 0.50
2,885
465
100%
3,309
0.37%
77,001
21.50%
345
10.41%
3
0.50 to < 0.75
2,872
32
100%
2,904
0.57%
124,819
21.85%
397
13.66%
4
0.75 to < 2.50
9,575
620
99%
10,176
1.44%
200,149
24.67%
2,336
22.96%
37
0.75 to < 1.75
7,809
453
99%
8,222
1.30%
96,806
23.92%
1,766
21.48%
26
1.75 to < 2.50
1,767
167
99%
1,954
2.05%
103,343
27.84%
570
29.17%
11
2.50 to < 10.00
4,243
209
99%
4,478
4.99%
120,978
26.03%
1,758
39.25%
58
2.50 to < 5.00
2,307
141
99%
2,481
3.70%
99,203
25.67%
921
37.15%
24
5.00 to < 10.00
1,936
67
99%
1,997
6.59%
21,775
26.47%
836
41.86%
34
10.00 to < 100.00
1,148
100
100%
1,289
18.75%
60,068
29.00%
616
47.82%
69
10.00 to < 20.00
788
73
100%
890
13.07%
34,721
28.10%
369
41.39%
31
20.00 to < 30.00
198
21
100%
230
25.32%
13,115
34.76%
155
67.32%
20
30.00 to < 100.00
161
5
100%
168
39.78%
12,232
25.91%
93
55.13%
18
100.00 (default)
1,283
5
57%
1,262
100.00%
39,732
41.73%
479
37.93%
706
Subtotal
22,111
1,443
99%
23,537
8.08%
623,530
25.26%
5,935
25.22%
876
(892)
Retail –
Other
non-SME0.00 to < 0.15
1,772
49
100%
1,815
0.09%
78,675
19.37%
85
4.70%
0
0.00 to < 0.10
1,472
45
100%
1,518
0.09%
4,181
17.62%
63
4.14%
0
0.10 to < 0.15
300
4
100%
297
0.10%
74,494
28.30%
23
7.58%
0
0.15 to < 0.25
7,284
1,260
97%
8,501
0.20%
92,564
13.35%
474
5.58%
2
0.25 to < 0.50
3,737
535
100%
4,262
0.40%
109,410
34.00%
924
21.68%
5
0.50 to < 0.75
2,392
167
95%
2,551
0.62%
340,553
34.35%
742
29.10%
5
0.75 to < 2.50
7,768
798
100%
8,546
1.36%
441,732
31.75%
3,229
37.78%
38
0.75 to < 1.75
5,911
712
100%
6,601
1.15%
324,999
30.42%
2,262
34.26%
23
1.75 to < 2.50
1,858
86
100%
1,944
2.06%
116,733
36.27%
967
49.75%
14
2.50 to < 10.00
5,257
340
100%
5,597
4.23%
329,660
34.67%
3,015
53.87%
83
2.50 to < 5.00
3,729
308
100%
4,037
3.29%
278,612
33.22%
2,050
50.77%
44
5.00 to < 10.00
1,528
32
100%
1,560
6.68%
51,048
38.43%
966
61.90%
39
10.00 to < 100.00
1,204
36
59%
1,225
25.18%
130,307
34.42%
960
78.37%
99
10.00 to < 20.00
564
34
55%
583
13.58%
54,226
39.60%
456
78.23%
31
20.00 to < 30.00
239
2
100%
241
23.85%
48,769
32.71%
198
82.22%
19
30.00 to < 100.00
400
1
100%
401
42.86%
27,312
27.90%
306
76.25%
49
100.00 (default)
1,545
7
99%
1,545
100.00%
137,827
51.38%
643
41.63%
919
Subtotal
30,960
3,191
98%
34,041
6.63%
1,660,728
28.44%
10,073
29.59%
1,151
(1,167)
TOTAL
623,975
215,549
52%
721,058
2.57%
10,206,145
16.21%
140,981
19.55%
6,261
(6,673)
(In EURm)
31.12.2020
PD scale(1)
Original
on-
balance
sheet gross
exposure
Off-
balance
sheet
exposures
pre CCF
Average
CCF
EAD post
CRM and
post-CCF
Average
PD(1)
Number
of
obligors
Average
LGD
Average
maturity
RWA
RWA
density
EL
Value
adjust-
ments
and
Provi-
sions
Central governments
and central banks0.00 to < 0.15
215,434
3,033
67%
250,956
0.02%
384
1.98%
1.18
2,083
1%
2
0.15 to < 0.25
-
-
-
-
-
0.25 to < 0.50
727
0
20%
3,234
0.26%
11
17.80%
2.79
719
22%
1
0.50 to < 0.75
11,990
150
75%
1,454
0.50%
8
32.58%
2.52
879
60%
2
0.75 to < 2.50
1,078
593
75%
2,526
1.76%
16
22.75%
2.60
1,206
48%
23
2.50 to < 10.00
2,928
1,317
68%
867
5.43%
54
23.86%
2.22
753
87%
12
10.00 to < 100.00
628
248
84%
362
11.65%
26
22.46%
1.99
386
107%
10
100.00 (default)
97
0
75%
62
100.00%
9
81.31%
1.12
4
7%
68
Subtotal
232,882
5,341
69%
259,461
0.10%
508
2.67%
1.23
6,029
2%
120
(101)
Institutions
0.00 to < 0.15
23,624
8,925
64%
36,845
0.04%
2,597
11.52%
2.47
1,667
5%
2
0.15 to < 0.25
-
-
-
-
-
0.25 to < 0.50
492
413
58%
797
0.26%
294
22.52%
1.54
175
22%
0
0.50 to < 0.75
6,993
3,723
23%
1,987
0.28%
134
14.12%
1.97
436
22%
1
0.75 to < 2.50
2,435
796
50%
1,135
1.58%
122
20.50%
1.54
645
57%
4
2.50 to < 10.00
1,559
629
52%
1,197
3.97%
398
24.09%
1.83
1,023
85%
13
10.00 to < 100.00
215
212
36%
178
14.28%
64
8.54%
1.05
257
144%
7
100.00 (default)
52
2
26%
31
100.00%
24
25.67%
3.04
55
176%
7
Subtotal
35,370
14,699
52%
42,170
0.34%
3,633
12.51%
2.38
4,259
10%
35
(78)
Corporate – SME
0.00 to < 0.15
852
486
53%
1,345
0.09%
3,234
36.31%
2.41
484
36%
3
0.15 to < 0.25
3,984
644
88%
3,482
0.20%
916
12.86%
2.23
305
9%
1
0.25 to < 0.50
1,484
848
52%
1,616
0.28%
7,423
36.74%
2.52
492
30%
2
0.50 to < 0.75
1,763
1,162
49%
2,965
0.53%
5,796
34.63%
2.77
1,272
43%
5
0.75 to < 2.50
10,617
1,771
53%
9,050
1.51%
15,661
28.78%
3.48
5,163
57%
40
2.50 to < 10.00
9,290
1,402
59%
8,302
4.53%
21,775
32.69%
2.86
6,483
78%
122
10.00 to < 100.00
3,000
248
54%
2,380
16.33%
7,310
30.66%
2.76
2,592
109%
118
100.00 (default)
1,799
226
47%
1,796
100.00%
5,796
37.38%
2.23
2,320
129%
846
Subtotal
32,790
6,787
56%
30,937
8.81%
67,911
29.98%
2.88
19,111
62%
1,137
(1,213)
Corporate – Specialised lending
0.00 to < 0.15
4,300
2,494
43%
9,549
0.07%
166
20.08%
3.00
1,331
14%
1
0.15 to < 0.25
-
-
-
-
-
0.25 to < 0.50
4,030
1,804
49%
4,523
0.26%
154
14.04%
2.97
733
16%
2
0.50 to < 0.75
7,509
2,823
44%
8,848
0.50%
354
13.27%
3.54
1,977
22%
6
0.75 to < 2.50
15,885
6,990
40%
14,026
1.49%
854
14.69%
3.25
5,452
39%
38
2.50 to < 10.00
8,415
2,865
38%
6,027
4.28%
744
13.95%
2.63
2,983
49%
45
10.00 to < 100.00
1,077
147
41%
468
15.06%
110
20.59%
3.38
478
102%
17
100.00 (default)
1,367
90
79%
1,179
100.00%
98
39.81%
2.21
624
53%
594
Subtotal
42,583
17,214
42%
44,619
3.98%
2,480
16.12%
3.12
13,577
30%
703
(820)
Corporate – Other
0.00 to < 0.15
18,971
80,335
46%
62,789
0.07%
3,158
35.15%
2.27
12,244
20%
16
0.15 to < 0.25
44
10
33%
19
0.16%
66
37.90%
2.07
5
28%
0
0.25 to < 0.50
7,602
20,891
47%
16,681
0.26%
1,523
31.41%
2.31
5,864
35%
16
0.50 to < 0.75
18,168
10,145
60%
12,037
0.50%
2,396
30.41%
2.21
5,600
47%
22
0.75 to < 2.50
18,216
16,007
48%
21,355
1.52%
5,599
25.31%
2.11
12,567
59%
92
2.50 to < 10.00
17,080
8,934
46%
16,847
4.39%
9,446
30.17%
2.26
16,345
97%
241
10.00 to < 100.00
4,678
1,951
43%
3,285
15.14%
2,561
31.92%
2.02
5,007
152%
155
100.00 (default)
2,770
3,120
9%
2,595
100.00%
1,642
36.01%
1.82
2,117
82%
1,337
Subtotal
87,530
141,392
47%
135,609
3.17%
26,391
32.00%
2.23
59,749
44%
1,880
(2,171)
Retail – Secured by real estate SME
0.00 to < 0.15
26
7
100%
79
0.03%
16,056
11.94%
27
34%
0
0.15 to < 0.25
3
-
3
0.21%
1
13.65%
0
6%
0
0.25 to < 0.50
824
10
100%
833
0.27%
4,875
16.19%
55
7%
0
0.50 to < 0.75
1,641
25
100%
1,666
0.62%
33
9.76%
155
9%
1
0.75 to < 2.50
2,376
33
100%
2,409
1.09%
13,088
14.12%
362
15%
4
2.50 to < 10.00
648
11
100%
659
2.92%
218
14.80%
190
29%
3
10.00 to < 100.00
236
3
100%
240
15.64%
846
9.83%
106
44%
4
100.00 (default)
133
1
85%
87
100.00%
569
40.01%
142
164%
24
Subtotal
5,887
90
100%
5,976
3.05%
35,686
13.44%
1,037
17%
36
(31)
Retail – Secured by
real estate non-SME0.00 to < 0.15
28,108
1,100
100%
29,795
0.06%
633,092
13.81%
2,102
7%
3
0.15 to < 0.25
24,934
653
89%
25,500
0.22%
6,520
14.41%
1,646
6%
8
0.25 to < 0.50
8,066
235
73%
8,128
0.41%
2,103
17.42%
1,014
12%
6
0.50 to < 0.75
11,883
437
84%
12,673
0.62%
118,318
10.64%
1,263
10%
8
0.75 to < 2.50
20,746
691
85%
20,843
1.45%
78,327
10.35%
3,547
17%
28
2.50 to < 10.00
6,427
129
93%
6,530
4.80%
32,627
12.37%
2,607
40%
36
10.00 to < 100.00
998
16
99%
1,010
18.16%
5,300
9.55%
546
54%
19
100.00 (default)
1,379
3
83%
783
100.00%
8,692
40.96%
1,569
200%
253
Subtotal
102,540
3,265
90%
105,261
1.68%
884,979
13.24%
14,294
14%
361
(351)
Retail – Qualifying revolving
0.00 to < 0.15
77
1,153
38%
618
0.10%
647,155
42.83%
19
3%
0
0.15 to < 0.25
251
40%
100
0.23%
70,150
35.31%
4
4%
0
0.25 to < 0.50
91
195
38%
313
0.41%
112,131
48.36%
31
10%
1
0.50 to < 0.75
106
555
36%
307
0.60%
509,746
35.90%
30
10%
1
0.75 to < 2.50
353
497
37%
760
1.47%
832,586
43.37%
174
23%
5
2.50 to < 10.00
656
253
37%
1,236
4.78%
1,382,948
45.23%
803
65%
27
10.00 to < 100.00
365
29
37%
430
21.45%
567,333
42.73%
466
108%
38
100.00 (default)
300
7
7%
300
100.00%
188,301
64.59%
213
71%
182
Subtotal
1,948
2,940
37%
4,064
11.48%
4,310,350
44.97%
1,740
43%
253
(235)
Retail –
Other SME0.00 to < 0.15
85
7
16%
89
0.06%
395
14.59%
184
207%
0
0.15 to < 0.25
16
7
6%
17
0.23%
2,300
29.09%
2
11%
0
0.25 to < 0.50
3,125
438
39%
3,296
0.38%
71,172
18.30%
298
9%
2
0.50 to < 0.75
2,989
29
73%
2,969
0.57%
117,846
19.54%
363
12%
3
0.75 to < 2.50
9,338
524
52%
9,618
1.45%
200,893
22.97%
2,069
22%
33
2.50 to < 10.00
4,183
202
55%
4,304
4.87%
125,697
24.73%
1,648
38%
53
10.00 to < 100.00
1,008
109
54%
1,089
20.09%
56,381
26.92%
496
46%
58
100.00 (default)
1,472
13
9%
1,469
100.00%
45,043
41.78%
595
41%
819
Subtotal
22,215
1,330
48%
22,850
9.04%
619,727
23.55%
5,654
25%
968
(1,007)
Retail –
Other
non-SME0.00 to < 0.15
1,698
165
23%
1,738
0.09%
82,040
17.52%
89
5%
0
0.15 to < 0.25
6,678
981
99%
6,717
0.20%
110,305
13.69%
384
6%
2
0.25 to < 0.50
4,562
548
90%
5,015
0.38%
89,812
31.13%
984
20%
6
0.50 to < 0.75
1,414
98
99%
2,453
0.62%
342,646
36.21%
759
31%
6
0.75 to < 2.50
7,924
370
82%
8,205
1.37%
450,064
33.17%
3,253
40%
38
2.50 to < 10.00
5,490
241
78%
5,676
4.24%
362,616
34.16%
3,081
54%
83
10.00 to < 100.00
1,241
20
90%
1,257
24.90%
135,258
34.52%
993
79%
103
100.00 (default)
1,825
10
72%
1,829
100.00%
163,376
47.73%
400
22%
1,044
Subtotal
30,832
2,433
88%
32,891
7.74%
1,736,117
29.31%
9,943
30%
1,281
(1,302)
TOTAL
594,577
195,491
49%
683,838
2.37%
7,687,782
15.16%
135,393
20%
6,773
(7,307)
(1)PD taking into account substitution and reduction effects as at 31 December 2020.
(In EURm)
31.12.2021
PD scale
On-
balance
sheet
exposures
Off-
balance
sheet
exposures
pre CCF
Exposure
weighted
average
CCF
Exposure
post CCF
and post
CRM
Exposure
weighted
average
PD
Number
of
obligors
Exposure
weighted
average
LGD (%)
Exposure
weighted
average
maturity
(years)
RWA
after SME
supporting
factor
Density
of RWA
Expected
loss
amount
Value
adjust-
ments
and
provi-
sions
Central governments and central banks
0.00 to < 0.15
19
-
19
0.01%
10
44.90%
3
2
9.72%
0
0.00 to < 0.10
19
-
19
0.01%
10
44.90%
3
2
9.72%
0
0.10 to < 0.15
-
-
0
0.00%
-
41.52%
3
0
8.96%
-
0.15 to < 0.25
-
-
-
-
-
-
-
0.25 to < 0.50
-
-
0
0.00%
-
41.38%
3
0
6.86%
-
0.50 to < 0.75
-
-
2
0.00%
-
2.78%
3
0
0.46%
-
0.75 to < 2.50
-
-
1
0.01%
-
41.38%
3
0
7.50%
0
0.75 to < 1.75
-
-
0
0.01%
-
41.38%
3
0
7.62%
0
1.75 to < 2.50
-
-
0
0.01%
-
41.38%
3
0
7.30%
0
2.50 to < 10.00
0
-
8
2.46%
1
41.49%
3
1
7.54%
0
2.50 to < 5.00
0
-
6
3.26%
1
41.61%
3
0
7.74%
0
5.00 to < 10.00
-
-
2
-
41.11%
3
0
6.92%
0
10.00 to < 100.00
-
-
2
-
41.32%
3
0
6.93%
0
10.00 to < 20.00
-
-
1
-
41.17%
3
0
6.90%
0
20.00 to < 30.00
-
-
1
-
41.68%
3
0
7.02%
0
30.00 to < 100.00
-
-
0
-
41.66%
3
0
7.01%
-
100.00 (default)
-
-
2
-
41.35%
3
0
8.92%
0
Subtotal
19
-
32
0.58%
11
41.57%
3
3
8.50%
0
(0)
Institutions
0.00 to < 0.15
0
-
0
0.05%
12
43.38%
3
0
24.92%
0
0.00 to < 0.10
0
-
0
0.03%
9
43.53%
3
0
20.03%
0
0.10 to < 0.15
0
-
0
0.13%
3
42.82%
3
0
43.68%
0
0.15 to < 0.25
-
-
-
-
-
-
-
0.25 to < 0.50
0
-
0
0.26%
2
40.00%
3
0
54.84%
0
0.50 to < 0.75
1
-
-
0.50%
1
0.00%
-
-
0.00%
-
0.75 to < 2.50
0
-
0
2.12%
1
40.58%
3
0
122.83%
0
0.75 to < 1.75
-
-
-
-
-
-
-
1.75 to < 2.50
0
-
0
2.12%
1
40.58%
3
0
122.83%
0
2.50 to < 10.00
0
-
0
5.73%
2
45.00%
3
0
197.12%
0
2.50 to < 5.00
0
-
0
3.26%
1
45.00%
3
0
169.81%
0
5.00 to < 10.00
0
-
0
7.76%
1
45.00%
3
0
219.49%
0
10.00 to < 100.00
-
-
-
-
-
-
-
10.00 to < 20.00
-
-
-
-
-
-
-
20.00 to < 30.00
-
-
-
-
-
-
-
30.00 to < 100.00
-
-
-
-
-
-
-
100.00 (default)
-
-
-
-
-
-
-
Subtotal
2
-
0
0.40%
18
43.26%
3
0
37.34%
0
(0)
Corporate – SME
0.00 to < 0.15
74
6
100%
78
0.12%
246
41.22%
3
18
22.89%
0
0.00 to < 0.10
6
-
6
0.04%
11
40.97%
3
1
16.30%
0
0.10 to < 0.15
68
6
100%
72
0.13%
235
41.24%
3
17
23.39%
0
0.15 to < 0.25
87
10
100%
95
0.16%
466
41.24%
3
24
24.82%
0
0.25 to < 0.50
146
17
100%
159
0.29%
603
41.72%
3
60
37.36%
0
0.50 to < 0.75
279
21
100%
295
0.55%
1,291
41.25%
3
140
47.59%
1
0.75 to < 2.50
630
58
100%
671
1.59%
2,950
41.67%
3
439
65.43%
4
0.75 to < 1.75
396
36
100%
421
1.20%
1,893
41.52%
3
263
62.41%
2
1.75 to < 2.50
234
21
100%
250
2.24%
1,057
41.92%
3
176
70.52%
2
2.50 to < 10.00
728
38
100%
748
4.53%
4,952
41.65%
3
630
84.32%
12
2.50 to < 5.00
565
32
100%
585
3.73%
3,768
41.79%
3
468
80.02%
8
5.00 to < 10.00
163
6
100%
163
7.40%
1,184
41.16%
3
163
99.73%
4
10.00 to < 100.00
182
3
100%
182
17.24%
1,471
41.28%
3
225
123.53%
10
10.00 to < 20.00
124
3
100%
125
13.33%
944
41.10%
3
154
123.41%
6
20.00 to < 30.00
50
0
100%
50
24.51%
414
41.87%
3
59
119.42%
3
30.00 to < 100.00
8
0
100%
8
33.66%
113
40.32%
3
12
151.45%
1
100.00 (default)
88
1
100%
87
100.00%
873
42.01%
3
2
2.04%
36
Subtotal
2,214
153
100%
2,315
7.13%
12,852
41.56%
3
1,538
66.43%
63
(60)
Corporate – Other
0.00 to < 0.15
1,014
10
100%
1,022
0.07%
537
41.66%
3
231
22.61%
0
0.00 to < 0.10
840
6
100%
844
0.06%
289
41.61%
3
171
20.30%
0
0.10 to < 0.15
174
4
100%
177
0.13%
248
41.88%
3
60
33.63%
0
0.15 to < 0.25
6
1
100%
7
0.17%
36
40.80%
3
2
29.06%
0
0.25 to < 0.50
195
7
100%
201
0.26%
347
41.72%
3
95
47.36%
0
0.50 to < 0.75
479
9
100%
486
0.51%
550
41.96%
3
323
66.31%
1
0.75 to < 2.50
673
34
100%
700
1.77%
1,412
41.51%
3
674
96.29%
5
0.75 to < 1.75
323
20
100%
339
1.17%
800
41.56%
3
286
84.39%
1
1.75 to < 2.50
351
14
100%
361
2.33%
612
41.47%
3
388
107.46%
3
2.50 to < 10.00
733
15
100%
746
4.85%
2,717
41.46%
3
978
131.14%
14
2.50 to < 5.00
541
11
100%
547
3.78%
2,211
41.68%
3
675
123.26%
8
5.00 to < 10.00
192
5
100%
198
7.80%
506
40.87%
3
303
152.94%
6
10.00 to < 100.00
146
3
100%
148
17.07%
681
40.98%
3
278
188.37%
9
10.00 to < 20.00
102
1
100%
102
13.17%
445
40.77%
3
194
189.54%
5
20.00 to < 30.00
38
1
100%
39
24.64%
214
41.62%
3
71
181.58%
3
30.00 to < 100.00
6
-
6
33.30%
22
40.36%
3
13
211.28%
1
100.00 (default)
44
-
43
100.00%
257
41.72%
3
0
0.12%
18
Subtotal
3,290
80
100%
3,352
3.60%
6,537
41.60%
3
2,581
76.98%
48
(40)
TOTAL
5,525
233
100%
5,700
5.02%
19,418
41.59%
3
4,121
72.30%
111
(100)
(In EURm)
31.12.2020
PD scale(1)
Original
on-
balance
sheet gross
exposure
Off-
balance
sheet
exposures
pre CCF
Average
CCF
EAD post
CRM and
post-
CCF
Average
PD(1)
Number
of
obligors
Average
LGD
Average
maturity
RWA
RWA
density
EL
Value
adjust-
ments
and
Provi-
sions
Central governments and central banks
0.00 to < 0.15
53
1
75%
64
0.01%
101
44.49%
2.50
6
10%
0
0.15 to < 0.25
-
-
-
-
-
0.25 to < 0.50
-
-
-
-
-
0.50 to < 0.75
-
-
-
-
-
0.75 to < 2.50
-
-
-
-
-
2.50 to < 10.00
-
-
-
-
-
10.00 to < 100.00
-
-
-
-
-
100.00 (default)
-
-
-
-
-
Subtotal
53
1
75%
64
0.01%
101
44.49%
2.50
6
10%
0
(0)
Institutions
0.00 to < 0.15
2
0
0%
2
0.03%
18
44.86%
2.50
0
16%
0
0.15 to < 0.25
-
-
-
-
-
0.25 to < 0.50
0
-
0
0.26%
1
45.00%
2.50
0
53%
0
0.50 to < 0.75
-
-
-
-
-
0.75 to < 2.50
0
-
0
1.13%
4
45.00%
2.50
0
129%
0
2.50 to < 10.00
0
-
0
3.30%
3
44.85%
2.50
0
139%
0
10.00 to < 100.00
0
-
0
14.33%
1
40.00%
2.50
0
206%
0
100.00 (default)
-
-
-
-
-
Subtotal
2
0
0%
2
0.13%
27
44.86%
2.50
0
20%
0
(0)
Corporate – SME
0.00 to < 0.15
40
6
46%
80
0.08%
183
42.84%
2.50
20
25%
0
0.15 to < 0.25
36
10
75%
43
0.16%
277
43.31%
2.50
11
26%
0
0.25 to < 0.50
89
5
75%
93
0.28%
459
42.79%
2.50
35
37%
0
0.50 to < 0.75
199
18
75%
174
0.54%
1,010
42.71%
2.50
86
49%
0
0.75 to < 2.50
477
43
75%
510
1.54%
2,885
42.78%
2.50
358
70%
3
2.50 to < 10.00
678
37
75%
704
4.69%
4,883
42.96%
2.50
692
98%
14
10.00 to < 100.00
208
5
75%
206
16.07%
1,583
42.92%
2.50
304
148%
14
100.00 (default)
103
1
75%
102
100.00%
965
43.99%
2.50
0
0%
45
Subtotal
1,830
124
74%
1,911
9.26%
12,245
42.94%
2.50
1,506
79%
77
(80)
Corporate – Other
0.00 to < 0.15
1,038
6
75%
1,061
0.08%
575
44.25%
2.50
257
24%
0
0.15 to < 0.25
1
0
75%
1
0.16%
15
44.38%
2.50
0
36%
0
0.25 to < 0.50
123
8
75%
132
0.26%
291
42.70%
2.50
65
49%
0
0.50 to < 0.75
452
13
75%
445
0.51%
498
43.53%
2.50
311
70%
1
0.75 to < 2.50
509
18
75%
523
1.57%
1,362
43.43%
2.50
537
103%
4
2.50 to < 10.00
832
47
75%
868
4.53%
2,998
43.20%
2.50
1,211
140%
17
10.00 to < 100.00
175
4
78%
173
14.64%
802
43.00%
2.50
351
202%
11
100.00 (default)
53
0
75%
53
100.00%
253
44.19%
2.50
0
0%
23
Subtotal
3,183
97
75%
3,255
3.97%
6,794
43.61%
2.50
2,733
84%
56
(69)
ALTERNATIVE TREATMENT: SECURED BY REAL ESTATE
Subtotal
398
-
100%
398
171
43%
-
-
TOTAL
5,466
222
74%
5,631
5.85%
19,167
43.38%
2.50
4,417
78%
134
(149)
(1)PD taking into account substitution and reduction effects as at 31 December 2020.
(In EURm)
31.12.2021
Pre-credit
derivatives RWA
Actual RWA
EXPOSURES UNDER FIRB
4,121
4,121
Central governments and central banks
3
3
Institutions
0
0
Corporates
4,118
4,118
of which Corporates – SMEs
1,538
1,538
of which Corporates – Specialised lending
-
-
EXPOSURES UNDER AIRB
142,083
141,733
Central governments and central banks
6,752
6,752
Institutions
4,523
4,523
Corporates
100,179
99,828
of which Corporates – SMEs
18,755
18,755
of which Corporates – Specialised lending
16,355
16,355
Retail
30,629
30,629
of which Retail – SMEs – Secured by immovable property collateral
929
929
of which Retail – non-SMEs – Secured by immovable property collateral
12,150
12,150
of which Retail – Qualifying revolving
1,542
1,542
of which Retail – SMEs – Other
5,935
5,935
of which Retail – Non-SMEs – Other
10,073
10,073
TOTAL
146,204
145,854
(In EURm)
31.12.2020
Pre-credit
derivatives RWA
Actual RWA
EXPOSURES UNDER FIRB
4,417
4,417
Central governments and central banks
6
6
Institutions
1
1
Corporates
4,409
4,409
of which Corporates – SMEs
1,605
1,605
of which Corporates – Specialised lending
-
-
EXPOSURES UNDER AIRB
137,149
136,188
Central governments and central banks
6,031
6,029
Institutions
4,273
4,259
Corporates
94,178
93,232
of which Corporates – SMEs
19,111
19,111
of which Corporates – Specialised lending
14,372
14,372
Retail
32,667
32,667
of which Retail – SMEs – Secured by immovable property collateral
1,037
1,037
of which Retail – non-SMEs – Secured by immovable property collateral
14,294
14,294
of which Retail – Qualifying revolving
1,740
1,740
of which Retail – SMEs – Other
5,654
5,654
of which Retail – Non-SMEs – Other
9,943
9,943
TOTAL
141,566
140,604
(In EURm)
31.12.2021
Total
exposures
Credit risk mitigation techniques
Part of
exposures
covered by
Financial
collaterals (%)
Part of
exposures
covered by
other eligible
collaterals (%)
Funded credit Protection (FCP)
Part of
exposures
covered by
immovable
property
collaterals (%)
Part of
exposures
covered by
receivables (%)
Part of
exposures
covered by
other physical
collateral (%)
Central governments and central banks
243,483
0.09%
0.19%
-
-
0.19%
Institutions
40,409
0.71%
0.93%
0.25%
0.18%
0.50%
Corporates
261,216
1.79%
17.30%
7.69%
4.79%
4.81%
of which Corporates – SMEs
37,063
1.24%
19.67%
18.03%
0.49%
1.15%
of which Corporates – Specialised lending
61,548
1.37%
32.77%
15.61%
3.23%
13.93%
of which Corporates – Other
162,604
2.07%
10.90%
2.33%
6.37%
2.20%
Retail
177,266
-
71.94%
69.09%
-
2.85%
of which Retail – Immovable property SMEs
5,664
-
94.80%
94.80%
-
-
of which Retail – Immovable property non-SMEs
108,619
-
99.93%
99.93%
-
-
of which Retail – Qualifying revolving
5,398
-
-
-
-
-
of which Retail – Other SMEs
23,543
-
19.42%
8.81%
-
10.61%
of which Retail – Other non-SMEs
34,043
-
26.54%
19.05%
-
7.49%
TOTAL
722,373
0.71%
24.02%
19.75%
1.74%
2.53%
(In EURm)
31.12.2021
Credit risk
Mitigation techniques
Credit risk
mitigation methods in the calculation of RWA
Unfunded credit Protection (UFCP)
RWA without
substitution effects
(reduction effects only)
RWA with substitution
effects (both reduction
and sustitution effects)
Part of exposures
covered by
Guarantees (%)
Part of exposures
covered by
Credit Derivatives (%)
Central governments and central banks
3.32%
-
6,162
6,752
Institutions
9.20%
-
4,315
4,523
Corporates
18.31%
0.57%
100,532
99,828
of which Corporates – SMEs
16.33%
0.01%
18,994
18,755
of which Corporates – Specialised lending
24.22%
-
16,692
16,355
of which Corporates – Other
16.53%
0.92%
64,845
64,718
Retail
0.86%
-
30,724
30,629
of which Retail – Immovable property SMEs
4.04%
-
929
929
of which Retail – Immovable property non-SMEs
0.36%
-
12,244
12,150
of which Retail – Qualifying revolving
-
-
1,542
1,542
of which Retail – Other SMEs
0.52%
-
5,936
5,935
of which Retail – Other non-SMEs
2.28%
-
10,073
10,073
TOTAL
8.47%
0.21%
141,733
141,733
(In EURm)
30.06.2021
Total
exposures
Credit risk mitigation techniques
Part of
exposures
covered by
Financial
collaterals (%)
Part of
exposures
covered by
other eligible
collaterals (%)
Funded credit Protection (FCP)
Part of
exposures
covered by
immovable
property
collaterals (%)
Part of
exposures
covered by
receivables (%)
Part of
exposures
covered by
other physical
collateral (%)
Central governments and central banks
226,519
0.09%
0.20%
-
-
0.20%
Institutions
39,281
0.85%
1.07%
0.26%
-
0.81%
Corporates
245,642
1.65%
16.64%
7.75%
4.33%
4.56%
of which Corporates – SMEs
36,773
1.21%
19.39%
17.84%
0.51%
1.04%
of which Corporates – Specialised lending
56,080
1.06%
33.80%
16.44%
3.35%
14.01%
of which Corporates – Other
152,790
1.97%
9.68%
2.13%
5.61%
1.94%
Retail
171,093
-
71.95%
69.14%
-
2.80%
of which Retail – Immovable property SMEs
5,833
-
94.54%
94.54%
-
-
of which Retail – Immovable property non-SMEs
104,539
-
99.89%
99.89%
-
-
of which Retail – Qualifying revolving
3,983
-
-
-
-
-
of which Retail – Other SMEs
22,687
-
19.33%
9.04%
-
10.28%
of which Retail – Other non-SMEs
34,050
-
25.75%
18.51%
-
7.24%
TOTAL
682,534
0.67%
24.15%
20.14%
1.56%
2.46%
(In EURm)
30.06.2021
Credit risk
Mitigation techniques
Credit risk
mitigation methods in the calculation of RWA
Unfunded credit Protection (UFCP)
RWA without
substitution effects
(reduction effects only)
RWA with substitution
effects (both reduction
and sustitution effects)
Part of exposures
covered by
Guarantees (%)
Part of exposures
covered by
Credit Derivatives (%)
Central governments and central banks
3.74%
-
5,816
6,332
Institutions
6.42%
-
3,720
3,790
Corporates
17.74%
0.51%
97,549
96,966
of which Corporates – SMEs
17.11%
-
19,298
19,079
of which Corporates – Specialised lending
23.50%
-
15,919
15,626
of which Corporates – Other
15.77%
0.82%
62,331
62,261
Retail
0.93%
-
29,866
29,863
of which Retail – Immovable property SMEs
4.29%
-
956
956
of which Retail – Immovable property non-SMEs
0.40%
-
11,563
11,561
of which Retail – Qualifying revolving
0.01%
-
1,410
1,410
of which Retail – Other SMEs
0.59%
-
5,884
5,883
of which Retail – Other non-SMEs
2.31%
-
10,053
10,052
TOTAL
8.23%
0.18%
136,950
136,950
(In EURm)
31.12.2021
Total
exposures
Credit risk mitigation techniques
Part of
exposures
covered by
Financial
collaterals (%)
Part of
exposures
covered by
other eligible
collaterals (%)
Funded credit Protection (FCP)
Part of
exposures
covered by
Immovable
property
collaterals (%)
Part of
exposures
covered by
receivables (%)
Part of
exposures
covered by
other physical
collateral (%)
Central governments and central banks
19
-
47.58%
-
-
47.58%
Institutions
2
-
5.69%
-
-
5.69%
Corporates
5,679
-
67.70%
0.01%
-
67.69%
of which Corporates – SMEs
2,329
-
68.00%
0.02%
-
67.98%
of which Corporates – Specialised lending
-
-
0.00%
-
-
-
of which Corporates – Other
3,350
-
67.50%
-
-
67.50%
TOTAL
5,700
-
67.62%
0.01%
-
67.61%
(In EURm)
31.12.2021
Credit risk
Mitigation techniques
Credit risk
mitigation methods in the calculation of RWA
Unfunded credit Protection (UFCP)
RWA without
substitution effects
(reduction effects only)
RWA with substitution
effects (both reduction
and sustitution effects)
Part of exposures
covered by
Guarantees (%)
Part of exposures
covered by
Credit Derivatives (%)
Central governments and central banks
-
-
2
3
Institutions
83.59%
-
0
0
Corporates
0.87%
-
4,119
4,118
of which Corporates – SMEs
0.90%
-
1,542
1,538
of which Corporates – Specialised lending
-
-
-
-
of which Corporates – Other
0.85%
-
2,577
2,581
TOTAL
0.89%
-
4,121
4,121
(In EURm)
30.06.2021
Total
exposures
Credit risk mitigation techniques
Part of
exposures
covered by
Financial
collaterals (%)
Part of
exposures
covered by
other eligible
collaterals (%)
Funded credit Protection (FCP)
Part of
exposures
covered by
Immovable
property
collaterals (%)
Part of
exposures
covered by
receivables (%)
Part of
exposures
covered by
other physical
collateral (%)
Central governments and central banks
52
-
44.55%
-
-
44.55%
Institutions
3
-
19.57%
-
-
19.57%
Corporates
5,709
0.06%
65.16%
0.19%
0.01%
64.97%
of which Corporates – SMEs
2,288
-
66.32%
-
-
66.32%
of which Corporates – Specialised lending
-
-
-
-
-
-
of which Corporates – Other
3,421
0.10%
64.39%
0.32%
0.01%
64.06%
TOTAL
5,765
0.06%
64.95%
0.19%
0.01%
64.76%
(In EURm)
30.06.2021
Credit risk
Mitigation techniques
Credit risk
mitigation methods in the calculation of RWA
Unfunded credit Protection (UFCP)
RWA without
substitution effects
(reduction effects only)
RWA with substitution
effects (both reduction
and sustitution effects)
Part of exposures
covered by
Guarantees (%)
Part of exposures
covered by
Credit Derivatives (%)
Central governments and central banks
6.80%
-
5
6
Institutions
-
-
1
1
Corporates
0.55%
-
4,251
4,250
of which Corporates – SMEs
0.89%
-
1,581
1,576
of which Corporates – Specialised lending
-
-
-
-
of which Corporates – Other
0.32%
-
2,670
2,674
TOTAL
0.61%
-
4,256
4,256
(In EURm)
Risk-weighted assets
RWA as at the end of the previous reporting period (30.09.2021)
168,980
Asset size (+/-)
4,331
Asset quality (+/-)
(460)
Model updates (+/-)
-
Methodology and policy (+/-)
-
Acquisitions and disposals (+/-)
-
Foreign exchange movements (+/-)
896
Other (+/-)
-
RWA as at the end of the reporting period (31.12.2021)
173,747
(In EURm)
31.12.2021
Specialised lending: Income-producing real estate and high volatility commercial real estate (Slotting approach)
Regulatory categories
Remaining maturity
On-balance
sheet
exposureOff-balance
sheet
exposureRisk weight
Exposure
valueRWA
Expected loss
amountCategory 1
Less than 2.5 years
190
1,517
50%
657
315
-
Equal to or more than 2.5 years
12
61
70%
32
22
0
Category 2
Less than 2.5 years
378
378
70%
537
331
2
Equal to or more than 2.5 years
10
3
90%
11
8
0
Category 3
Less than 2.5 years
31
53
115%
52
53
1
Equal to or more than 2.5 years
1
-
115%
1
0
0
Category 4
Less than 2.5 years
3
9
250%
7
15
0
Equal to or more than 2.5 years
1
2
250%
3
7
0
Category 5
Less than 2.5 years
15
2
-
16
-
7
Equal to or more than 2.5 years
-
-
-
-
-
-
TOTAL
Less than 2.5 years
618
1,959
1,269
713
11
Equal to or more than 2.5 years
24
66
46
38
0
(In EURm)
31.12.2020
Specialised lending: Income-producing real estate and high volatility commercial real estate (Slotting approach)
Regulatory categories
Remaining maturity
On-balance
sheet exposureOff-balance
sheet exposureRisk weight
Exposure
valueRWA
Expected loss
amountCategory 1
Less than 2.5 years
311
1,545
50%
844
404
-
Equal to or more than 2.5 years
8
73
70%
23
16
0
Category 2
Less than 2.5 years
299
420
70%
479
289
2
Equal to or more than 2.5 years
17
15
90%
21
19
0
Category 3
Less than 2.5 years
30
40
115%
46
46
1
Equal to or more than 2.5 years
1
0
115%
1
1
0
Category 4
Less than 2.5 years
6
3
250%
7
13
1
Equal to or more than 2.5 years
1
2
250%
3
7
0
Category 5
Less than 2.5 years
12
3
-
12
-
6
Equal to or more than 2.5 years
6
-
-
6
-
3
TOTAL
Less than 2.5 years
657
2,011
1,388
752
10
Equal to or more than 2.5 years
32
90
53
43
3
(In EURm)
31.12.2021
Equity exposures under the simple risk-weighted approach
Categories
On-balance
sheet exposureOff-balance
sheet exposureRisk weight
Exposure
valueRWA
Expected loss
amountPrivate equity exposures
354
-
190%
354
673
3
Exchange-traded equity exposures
21
-
290%
21
62
0
Other equity exposures
751
-
370%
751
2,780
18
TOTAL
1,127
-
1,127
3,515
21
(In EURm)
31.12.2020
Equity exposures under the simple risk-weighted approach
Categories
On-balance
sheet
exposureOff-balance
sheet
exposureRisk weight
Exposure
valueRWA
Expected loss
amountPrivate equity exposures
351
-
190%
351
668
3
Exchange-traded equity exposures
25
-
290%
25
74
0
Other equity exposures
706
-
370%
706
2,614
17
TOTAL
1,083
-
1,083
3,355
20
-
7 COUNTERPARTY CREDIT RISK
Counterparty credit risk is the risk of losses stemming from market operations, should a counterparty fail to meet its payment obligations. The future market value of the exposure and the counterparty’s credit quality are uncertain and may vary over time as underlying market parameters change.
Counterparty credit risk covers the replacement risk resulting from the default of a counterparty, the CVA (Credit Valuation Adjustment) risk related to the adjustment to the value of the Group portfolio, and the risk over central counterparties (CCP) following the clearing of market transactions. It is also affected by the wrong-way risk.
Counterparty credit risk RWA at end 2021:
EUR 27.5bn
(Counterparty credit risk RWA at end 2020: EUR 26.3bn)
-
7.1 LIMIT SETTING AND FRAMEWORK MONITORING
Counterparty credit risk is the risk of losses on market operations, resulting from the inability of the counterparties facing the Group to meet their financial commitments.
Counterparty credit risk covers replacement risk in the event of default of one of our counterparties, the risk of CVA (Credit Valuation Adjustment) related to the adjustment of the value of our portfolio and the risk on central counterparties (Central Counterparty or CCP) following the clearing of market transactions.
The value of the exposure to a counterparty and its credit quality are uncertain and variable over time, and they are affected by changes in market parameters. Counterparty credit risk may increase in the event of an adverse correlation (Wrong Way Risk), i.e. when the Group’s exposure to a counterparty increases at the same time as the credit quality of this counterparty deteriorates (i.e. when its probability of default increases).
Transactions involving counterparty credit risk include delivered pensions, securities lending and borrowing, and derivatives contracts, whether they are dealt with as principal activity or on behalf of third parties (agency activities or client clearing) in the context of market activities.
Counterparty credit risk is framed through a set of limits that reflect the Group’s appetite for risk.
■a system of delegation of competence, largely based on the internal rating of the counterparties, confers decision-making capacities to the risk units on the one hand and the customer monitoring sector on the other hand;
■the limits and internal rating set for each counterparty are proposed by the client monitoring sector and validated by the dedicated risk unit in charge of the counterparty type. Limits can be individual at the level of the counterparty, or global over a set of counterparties in the case of monitoring exposures in stress tests, for example.
These limits are subject to annual or ad hoc reviews depending on he needs and changing market conditions.
A dedicated team within the Risk Department is in charge of production, reporting and controls on risk metrics, namely:
■ensuring the completeness and reliability of the risk calculation by taking into account all the transactions booked by the transaction processing department;
■controlling compliance with defined limits, at the frequency of metrics calculation, most often on a daily basis: breaches of limits are reported to Front Office and Credit Officer for remediation actions.
In addition, a specific monitoring and approval process is implemented for the most sensitive counterparties or the most complex categories of financial instruments.
While not a substitute for CORISQ or for the Risk Committee of the Board of Directors (see the section on Risk management governance), the Counterparty Credit Risk Committee (CCRC) closely monitors counterparty credit risk through:
■a global overview on exposure and counterparty risk metrics such as the global stress tests, the Potential Future Exposure PFE, etc., as well as focuses on specific activities such as collateralised financing, or agency business;
This Committee, chaired by the Risk Department on a monthly basis, brings together representatives from the Market Activities and the Global Banking and Advisory Business Units, but also departments that, within the risk management function, are in charge of monitoring counterparty credit risks on market transactions and credit risk. The CCRC also provides an opinion on the changes to the risk frameworks within its authority.
■established by maturity buckets to control future exposure using the Potential Future Exposure (PFE) measure also known as CVaR within Societe Generale;
■calibrated according to the credit quality and the nature of the counterparty, the nature/maturity of the financial instruments contemplated (FX transactions, repos transactions, security lending transactions, derivatives, etc.), and the economic understanding, the contractual legal framework agreed and any other risk mitigants.
■a multifactor stress test on all counterparties, which allows to holistically quantify the potential loss on market activities following market movements which could trigger a wave of defaults on these counterparties;
■a set of single-factor stress tests to monitor the general wrong-way risk (see section on Wrong Way Risk).
In addition to the replacement risk, the CVA (Credit Valuation Adjustment) measures the adjustment of the value of the Group’s derivatives and repos portfolio in order to take into account the credit quality of the counterparties facing the Group (see dedicated section).
Positions taken to hedge the volatility of the CVA (credit, interest rate or equity instruments) are monitored through:
■stress test limits: scenarios representative of the market risks impacting the CVA (credit spreads, interest rates, exchange rates and equity) are applied to carry out the stress test on CVA.
The different indicators and the stress tests are monitored on the net amount (the sum of the CVA exposure and of their hedges).
Clearing of transactions is a common market practice for SG, notably in compliance with the EMIR (European Market Infrastructure Regulation) regulations in Europe and the DFA (Dodd-Frank Act) in the United States, which require that the most standardised over-the-counter transactions be compensated via clearing houses approved by the authorities and subject to prudential regulation.
As a member of the clearing houses with which it operates, the Group contributes to their risk management framework through deposits into the defaults funds, in addition to margin calls.
The counterparty credit risk stemming from the clearing of derivatives and repos with central counterparties (CCP) is subject to a specific framework on:
■a stress test defined to capture the impact of a scenario where a major CCP member should default.
-
7.2 MITIGATION OF COUNTERPARTY CREDIT RISK ON MARKET OPERATIONS
■the signing, in the most extensive way possible, of close-out netting agreements for over-the-counter (OTC) transactions and Securities Financing Transactions (SFT);
■the collateralisation of market operations, either through clearing houses for eligible products (listed products and certain of the more standardised OTC products), or through a bilateral margin call exchange mechanism which covers both current exposure (variation margins) but also future exposure (initial margins).
Societe Generale’s standard policy is to conclude master agreements including provisions for close-out netting.
These provisions allow on the one hand the immediate termination (close out) of all transactions governed by these agreements when one of the parties defaults, and on the other hand the settlement of a net amount corresponding to the total value of the portfolio, after netting of mutual debts and claims. This balance may be the subject of a guarantee or collateralisation. It results in a single net claim owed by or to the counterparty.
In order to reduce the legal risk associated with documentation and to comply with key international standards, the Group documents these agreements under the main international standards as published by national or international professional associations such as International Swaps and Derivatives Association (ISDA), International Capital Market Association (ICMA), International Securities Lending Association (ISLA), French Banking Federation (FBF), etc.
These contracts establish a set of contractual terms generally recognised as standard and give way to the modification or addition of more specific provisions between the parties in the final contract, for example regarding the triggering events. This standardisation reduces implementation times and secures operations. The clauses negotiated by clients outside the bank’s standards are approved by the decision-making bodies in charge of the master agreements standards – Normative Committee and/or Arbitration Committee – made up of representatives of the Risk Division, the Business Units, the Legal Division and other decision-making departments of the bank. In accordance with regulatory requirements, the clauses authorising global close-out netting and collateralisation are analysed by the bank’s legal departments to ensure that they are enforceable under the legal provisions applicable to clients.
Most of over-the-counter transactions are collateralised. There are two types of collateral exchanges:
■initial margin (IM) or Independent Amount (IA(1)): an initial amount of collateral aiming at covering potential future exposure, i.e. the unfavourable change in the Mark-to-Market of positions in the time period between the last collection of margins and the liquidation of positions following the counterparty default;
■variation margin (VM): collateral collected to cover current exposure arising from Mark-to-Market changes, used as an approximation of the actual loss resulting from the default of one of the counterparties.
All aspects of the margining regime are defined in collateral arrangements, such as credit support annexes (CSA(2)). The main features defined are:
■the eligible collateral and the applicable haircut: main types of collateral exchanged are cash or high-quality and liquid assets according to the Group’s policy, and are subject to a haircut, which is the valuation percentage applicable to each type of collateral, based on liquidity and price volatility of the underlying during both normal and stressed market conditions;
In addition, specific parameters or optional features can be defined depending on the type of counterparty/transaction, such as an additional guarantee amount (flat-rate increase of the exposure allowing the party making a margin call to be “over-collateralised”), or rating-dependent clauses, typically mutual in nature, where additional collateral is requested in case of a party’s rating downgrade.
The Group monitors given and received collateral exchanges. In case of discrepancies between the parties with respect to margin call amounts, dedicated teams from the operations and the risk departments are in charge of analysing the impacted transactions to ensure they are correctly valued and of addressing the issue.
The initial margin, historically very rare except with hedge funds, was generalised by EMIR and DFA regulations which introduced the mandatory use of master agreements and related CSA, prior to or when entering into an uncleared OTC derivatives transactions. It is now mandatory for the Group to exchange IM and VM for non-cleared OTC derivatives transactions with a large number of its counterparties (its financial counterparties and some non-financial counterparties above certain thresholds defined by the regulation, with compliance dates depending on the volume of transactions).
The Regulatory Technical Standards (RTS) on Initial Margin Model Validation (IMMV) under EMIR allows counterparties subject to mandatory bilateral collateral exchange requirements to waive these rules in certain circumstances. The Group has incorporated a waiver application process for intra-group entities into its risk management policies. The eligibility criteria for this waiver are framed and monitored as required by the Delegated Regulation.
EMIR and DFA regulations have also required that the most standard over-the-counter derivatives transactions be compensated through clearing houses. The Group thus compensates its own operations (principal activity), but also client clearing activities (agency-type activity), which are subject to systematic margin calls to mitigate counterparty credit risk (customers posting daily variation margins and initial margins to Societe Generale, in order to cover current exposure and future exposure). The Regulatory Technical Standards (RTS) on Initial Margin Model Validation (IMMV) under EMIR allows counterparties to waive the mandatory clearing via a clearing house for intra-group transactions for standardised derivatives transactions. The Group includes and applies this exemption according to the rules and criteria defined.
■applying the bilateral set-off of daily amounts payable in the same currency (payment netting), either to all derivatives, or by class of derivatives cleared by the CCP;
■providing in most cases for the termination of cleared transactions by the CCP in the event of its default.
In addition to margin requirements for some counterparties or mandatory clearing for the most standardised derivatives transactions, DFA and EMIR provide for an extensive framework for the regulation and transparency of OTC derivatives markets, such as reporting of OTC derivatives, timely confirmation or trade acknowledgement.
(1)IA (Independent Amount) is the same concept as initial margin, but applies to different perimeters (OTC swaps not cleared for IA).
-
7.3 COUNTERPARTY CREDIT RISK MEASURES
The measure of replacement risk is based on an internal model that determines the Group’s exposure profiles. As the value of the exposure to a counterparty is uncertain and variable over time, we estimate the potential future replacement costs over the lifetime of the transactions.
The future fair value of market transactions with each counterparty is estimated from Monte Carlo models based on a historical analysis of market risk factors.
The principle of the model is to represent the possible future financial markets conditions by simulating the evolutions of the main risk factors to which the institution’s portfolio is sensitive. For these simulations, the model uses different diffusion models to account for the characteristics inherent in the risk factors considered and uses a 10-year history for calibration.
The transactions with the various counterparties are then revalued according to these different scenarios at the different future dates until the maturity of the transactions, taking into account the terms and conditions defined in the contractual legal framework agreed and the credit mitigants, notably in terms of netting and collateralisation only to the extent we believe that the credit mitigants provisions are legally valid and enforceable.
The distribution of the counterparty exposures thus obtained allows the calculation of regulatory capital for counterparty credit risk and the economic monitoring of positions.
The Risk Department responsible for Model Risk Management at Group level, assesses the theoretical robustness (review of the design and development quality), the compliance of the implementation, the suitability of the use of the model and continuous monitoring of the relevance of the model over time. This independent review process ends with (i) a report that describes the scope of the review, the tests carried out, the results of the review, the conclusions or recommendations and (ii) review and approval Committees.
This model review process gives rise to (i) recurring reports to the Risk Management Department within the framework of various committees and processes (Group Model Risk Management Committee, Risk Appetite Statement/Risk Appetite Framework, monitoring of recommendations, etc.) and (ii) a yearly report to the Board of Directors (CORISQ).
With respect to the calculation of capital requirements for counterparty credit risk, the ECB, following the Targeted Review of Internal Models, has renewed the approval for using the internal model described above to determine the Effective Expected Positive Exposure (EEPE) indicator.
For products not covered by the internal model as well as for entities in the Societe Generale Group that have not been authorised by the supervisor to use the internal model, the Group uses the market-price valuation method for derivatives(1) and the general financial security-based method for securities financing transactions (SFT(2)).
The effects of compensation agreements and collateralisation are taken into account either by their simulation in the internal model when such credit risk mitigant or guarantees meet regulatory criteria, or by applying the rules as defined in the market-price valuation method or the financial security-based method, by subtracting the value of the collateral.
These exposures are then weighted by rates resulting from the credit quality of the counterparty to compute the Risk Weighted Assets (RWA). These rates can be determined by the standard approach or the advanced approach (IRBA).
As a general rule, when EAD is modelled in EEPE and weighted according to IRB approach, there is no adjustment of the LGD according to the collateral received as it is already taken into account in the EEPE calculation.
The RWA breakdown for each approach is available in the “Analysis of Counterparty Credit Risk Exposure by Approach” table in Section 7.4 “Quantitative Information”.
For the economic monitoring of positions, Societe Generale relies mainly on a maximum exposure indicator determined from the Monte Carlo simulation, called internally Credit Value-at-Risk (CVaR) or PFE (Potential Future Exposure). This is the maximum amount of loss that could occur after eliminating 1% of the most adverse occurrences. This indicator is calculated at different future dates, which are then aggregated into segments, each of them being framed by limits.
The Group has also developed a set of stress test scenarios to determine the exposure that would result from changes in the fair value of transactions with all its counterparties in the event of an extreme shock affecting the market parameters.
(1)In this method, the EAD (Exposure At Default) relating to the Bank’s counterparty credit risk is determined by aggregating the positive market values of all transactions (replacement cost) supplemented by an add-on factor.
The CVA (Credit Valuation Adjustment) refers to adjustment to marked-to-market of the derivatives and repos portfolio to take into account the credit quality of each counterparty facing the Group in the valuation. This adjustment is equivalent to the counterparty credit risk hedging cost in the Credit Default Swap (CDS) market.
■the positive expected exposure to the counterparty, which is the average of the positive hypothetical future exposure values for a transaction or a group of transactions. It is mainly determined using risk neutral Monte Carlo simulations of risk factors that may affect the valuation of the derivatives transactions. The transactions are revalued through time according to the different scenarios, taking into account the terms and conditions defined in the contractual legal framework agreed, notably in terms of netting and collateralisation (i.e. that transactions with appropriate credit mitigants will generate lower expected exposure compared to transactions without credit mitigants);
■the amount of losses in the event of default (LGD – Loss Given Default taking into account the recovery rate).
The Group calculates this adjustment for all counterparties which are not subject to a daily margin call or for which collateral only partially covers the exposure.
The financial institutions are subject to the calculation of a capital requirement under the CVA, to cover its variation over ten days. The scope of counterparties is reduced to financial counterparties as defined in EMIR (European Market Infrastructure Regulation) or to certain Corporates that may use derivatives beyond certain thresholds and for purposes other than hedging.
■the positive expected exposure to the counterparty is mainly determined using the internal model described in section 7.3 “replacement risk”, which estimates the future exposure profiles to a counterparty, taking into account counterparty credit risk mitigants;
■the VaR and the Stressed VaR on CVA are determined using a similar methodology to the one developed for the calculation of the market VaR (see market risk chapter). This method consists of an “historical” simulation of the change in the CVA due to fluctuations in the credit spreads observed on the counterparties in portfolio, with a confidence interval of 99%. The calculation is made on the credit spreads variation observed, on the one hand, over a one-year rolling period (VaR on CVA), and, on the other hand, over a fixed one-year historical window corresponding to the period of greatest tension in terms of credit spreads (stressed VaR on CVA);
■the capital charge is the sum of two elements: VaR on CVA and Stressed VaR on CVA multiplied by a coefficient set by the regulator, specific to each bank.
The positions not taken into account in the advanced method are subject to a capital charge determined through the standard method by applying a normative weighting factor to the product of the EAD (Exposure At Default) by a maturity calculated according to the rules defined by the CRR (Capital Requirement Regulation); see the “Credit Valuation Adjustment (CVA)” capital requirements table in Section 7.4 “Quantitative Information”) for the breakdown of CVA-related RWA between advanced and standard methods.
The management of this exposure and of this regulatory capital charge led the Bank to purchase hedging instruments such as Credit Default Swap (CDS) from large credit institutions on certain identified counterparties or on indices composed of identifiable counterparties. In addition to reducing credit risk, it decreases the variability of the CVA and the associated capital amounts resulting from fluctuations in counterparty credit spreads.
Wrong-way risk is the risk of the Group’s exposure to a counterparty increasing significantly, combined with a simultaneous increase in the probability of the counterparty defaulting.
■general wrong-way risk arises when the likelihood of default by counterparties is positively correlated with general market risk factors;
■specific wrong-way risk arises when future exposure to a specific counterparty is positively correlated with the counterparty’s probability of default due to the nature of the transaction with the counterparty.
Specific wrong-way risk, in the case of a legal link between the counterparty and the underlying of a transaction concluded with the counterparty, is subject to dedicated regulatory capital requirements, calculated on the perimeter of transactions carrying such risk. Furthermore, for counterparties subject to such a specific risk, the Potential Future Exposure (PFE) is also increased, so that the transactions allowed by the limits in place will be more constrained than in the absence of specific risk.
The general wrong-way risk is controlled via a set of stress tests applied to transactions made with a given counterparty, based on scenarios common with the market stress tests. This set-up is based on:
■a quarterly analysis of stress tests on all counterparties (financial institutions, corporates, sovereigns, hedge funds and proprietary trading groups) for principal and agency (client clearing) businesses, allowing to understand the most adverse scenarios related to a joint deterioration in the quality of counterparties and the associated positions;
-
7.4 QUANTITATIVE INFORMATION
(In EURm)
31.12.2021
IRB
Standard
Total
Exposure classes
Exposure
EAD
RWA
Exposure
EAD
RWA
Exposure
EAD
RWA
Sovereign
24,471
24,511
395
177
177
4
24,648
24,688
399
Institutions
16,653
16,727
3,664
38,068
38,363
960
54,721
55,090
4,624
Corporates
56,698
56,583
14,554
4,441
4,147
4,051
61,139
60,730
18,605
Retail
83
83
8
23
23
14
106
106
21
Other
7
7
2
4,295
4,295
1,022
4,302
4,302
1,023
TOTAL
97,912
97,912
18,622
47,004
47,004
6,051
144,916
144,916
24,673
(In EURm)
31.12.2020
IRB
Standard
Total
Exposure classes
Exposure
EAD
RWA
Exposure
EAD
RWA
Exposure
EAD
RWA
Sovereign
23,472
23,560
382
170
170
-
23,642
23,730
382
Institutions
19,536
19,673
3,387
23,628
23,928
1,403
43,164
43,601
4,789
Corporates
54,370
54,145
15,786
1,697
1,398
1,246
56,067
55,543
17,032
Retail
121
121
8
2
2
2
122
122
10
Other
1
1
-
3,499
3,499
986
3,500
3,500
987
TOTAL
97,500
97,500
19,563
28,996
28,996
3,636
126,496
126,496
23,199
The tables above feature amounts excluding the CVA (Credit Valuation Adjustment) which represents EUR 2.8 billion of risk-weighted assets (RWA) as at 31 December 2021 (vs. EUR 3.1 billion as at 31 December 2020).
(In EURm)
31.12.2021
Replacement
cost (RC)Potential
future
exposure
(PFE)EEPE
Alpha
used for
computing
regulatory
exposure
valueExposure
value
pre-CRMExposure
value
post-CRMExposure
valueRWA
Original Exposure Method
(for derivatives)-
-
1.4
-
-
-
-
Simplified SA-CCR (for derivatives)
-
-
1.4
-
-
-
-
SA-CCR (for derivatives)
2,027
20,727
1.4
67,282
31,808
31,794
9,304
IMM (for derivatives and SFTs)
35,417
1.85
472,121
62,416
62,322
13,088
of which securities financing transactions netting sets
16,892
395,150
28,067
28,067
2,142
of which derivatives and long settlement transactions netting sets
18,453
76,847
34,217
34,123
10,946
of which from contractual cross-product netting sets
71
124
132
132
-
Financial collateral simple method
(for SFTs)-
-
-
-
Financial collateral comprehensive method (for SFTs)
27,145
11,245
11,245
994
VaR for SFTs
-
-
-
-
TOTAL
566,548
105,470
105,361
23,385
(In EURm)
31.12.2020
Notional
Replace-
ment
cost/current
market
valuePotential
future
creditexposure
EEPE
Multiplier
EAD
post CRMRWA
Mark to market
21,626
29,694
26,586
5,677
Original exposure
Standardised approach
IMM (for derivatives and SFTs)
36,449
1.85
67,431
15,767
of which securities financing transactions
15,500
1.85
28,676
2,270
of which derivatives and long settlement transactions
20,949
1.85
38,756
13,497
of which from contractual cross-product netting
Financial collateral simple method (for SFTs)
Financial collateral comprehensive method
(for SFTs)9,937
383
VaR for SFTs
TOTAL
21,827
(In EURm)
31.12.2021
31.12.2020
Exposure value
RWA
Exposure value
RWA
Exposures to QCCPs (total)
1,273
1,228
Exposures for trades at QCCPs (excluding initial margin and default fund contributions), of which:
7,083
142
10,038
201
(i) OTC derivatives
759
15
1,003
20
(ii) Exchange-traded derivatives
5,866
117
7,243
145
(iii) SFTs
457
9
1,791
36
(iv) Netting sets where cross-product netting has been approved
-
-
-
-
Segregated initial margin
22,466
12,701
Non-segregated initial margin
5,555
111
2,036
41
Pre-funded default fund contributions
3,992
1,020
3,474
986
Unfunded default fund contributions
-
-
-
-
Exposures to non-QCCPs
-
61
35
Exposures for trades at non-QCCPs (excluding initial margin and default fund contributions), of which:
-
-
-
-
(i) OTC derivatives
-
-
-
-
(ii) Exchange-traded derivatives
-
-
-
-
(iii) SFTs
-
-
-
-
(iv) Netting sets where cross-product netting has been approved
-
-
-
-
Segregated initial margin
-
35
35
Non-segregated initial margin
-
-
-
-
Pre-funded default fund contributions
-
-
25
-
Unfunded default fund contributions
-
-
-
-
(In EURm)
31.12.2021
Collateral used
in derivative transactionsCollateral used
in SFTsFair value
of collateral receivedFair value
of posted collateralFair value
of collateral receivedFair value
of posted collateralSegragated
Unsegragated
Segragated
Unsegragated
Segragated
Unsegragated
Segragated
Unsegragated
Cash – domestic currency
26,297
24,408
10,412
24,984
-
28,639
-
35,368
Cash – other currencies
98,096
53,981
44,928
69,676
-
4,483
-
8,383
Domestic sovereign debt
-
-
-
-
-
15
-
1
Other sovereign debt
15
-
-
-
-
4,931
-
6,451
Government agency debt
9,487
2,230
38
1,859
-
229,891
-
207,411
Corporate bonds
8
44
-
-
-
6,493
-
5,157
Equity securities
556
-
0
84
-
2,833
-
17,760
Other collateral
438
113
-
12
-
39,818
-
42,783
TOTAL
134,897
80,777
55,378
96,616
-
317,101
-
323,314
(In EURm)
31.12.2021
31.12.2020
Exposure value
RWA
Exposure value
RWA
Total transactions subject to the Advanced Method
33,066
2,218
37,471
2,783
(i) VaR component (including the 3×multiplier)
193
740
(ii) Stressed VaR component (including the 3×multiplier)
2,025
2,043
Transactions subject to the Standardised Method
6,812
589
5,349
347
Transactions subject to the Alternative approach
(based on Original Exposure Method)-
-
-
-
Total transactions subject to own funds requirements for CVA risk
39,878
2,807
42,821
3,131
The table below presents Group exposures subject to counterparty credit risk and for which an internal model is used with a view to calculating RWA. In accordance with EBA instructions, CVA charges and exposures cleared through CCPs have been excluded.
(In EURm)
31.12.2021
PD scale
Exposure
value
Exposure
weighted
average
PD (%)
Number of
obligors
Exposure
weighted
average
LGD (%)
Exposure
weighted
average
maturity
(years)
RWA
RWA
density
Central governments
and central banks0.00 to < 0.15
24,235
0.02%
102
2.83%
1
231
0.95%
0.15 to < 0.25
-
-
-
0.25 to < 0.50
73
0.26%
7
27.53%
2
22
29.73%
0.50 to < 0.75
18
-
1
-
5
-
-
0.75 to < 2.50
127
2.12%
1
20.00%
1
58
46.07%
2.50 to < 10.00
24
5.59%
14
31.79%
2
45
187.34%
10.00 to < 100.00
35
16.13%
7
23.20%
1
39
112.82%
100.00 (default)
-
-
-
Subtotal
24,511
0.06%
132
3.05%
1
395
1.61%
Institutions
0.00 to < 0.15
13,501
0.05%
693
34.00%
2
1,936
14.34%
0.15 to < 0.25
-
-
-
0.25 to < 0.50
788
0.26%
101
40.62%
2
386
49.00%
0.50 to < 0.75
657
0.50%
79
43.09%
2
446
67.88%
0.75 to < 2.50
1,232
1.97%
109
10.97%
1
304
24.70%
2.50 to < 10.00
505
3.85%
125
31.09%
1
512
101.29%
10.00 to < 100.00
44
13.19%
59
33.49%
1
80
180.28%
100.00 (default)
-
-
-
Subtotal
16,727
0.37%
1,166
32.88%
2
3,664
21.90%
Corporate
0.00 to < 0.15
41,669
0.05%
4,625
33.99%
1
5,306
12.73%
0.15 to < 0.25
13
0.20%
28
15.85%
1
1
10.84%
0.25 to < 0.50
3,408
0.26%
789
28.09%
3
1,097
32.18%
0.50 to < 0.75
4,234
0.52%
956
29.61%
3
1,823
43.05%
0.75 to < 2.50
3,816
1.56%
1,657
27.81%
3
2,422
63.49%
2.50 to < 10.00
2,851
4.13%
1,915
31.37%
2
3,053
107.09%
10.00 to < 100.00
444
13.70%
364
32.18%
3
696
156.95%
100.00 (default)
149
100.00%
70
43.30%
3
155
104.10%
Subtotal
56,583
0.77%
10,404
32.76%
1
14,554
25.72%
Retail
0.00 to < 0.15
-
-
-
0.15 to < 0.25
10
0.20%
975
11.50%
-
0
4.94%
0.25 to < 0.50
72
0.27%
82
17.36%
-
6
8.84%
0.50 to < 0.75
0
0.53%
47
28.75%
-
0
22.64%
0.75 to < 2.50
-
-
-
2.50 to < 10.00
-
-
-
10.00 to < 100.00
2
27.25%
1
24.00%
-
1
65.96%
100.00 (default)
-
-
-
Subtotal
83
0.75%
1,105
16.82%
-
8
9.45%
TOTAL
97,905
0.52%
12,807
25.33%
1
18,620
19.02%
(In EURm)
31.12.2020
PD scale(1)
Exposure
Value
Exposure
weighted
average
PD (%)(1)
Exposure
weighted
average
LGD (%)
Exposure
weighted
average
maturity
(years)
RWA
RWA
density
Central governments
and central banks0.00 to < 0.15
23,262
0.02%
1.68%
1.25
120
0.51%
0.15 to < 0.25
-
-
0.25 to < 0.50
22
0.26%
39.02%
1.00
7
32.39%
0.50 to < 0.75
12
0.50%
45.00%
3.56
10
86.91%
0.75 to < 2.50
111
2.12%
21.73%
0.98
56
49.99%
2.50 to < 10.00
153
4.50%
39.18%
1.36
189
124.01%
10.00 to < 100.00
-
-
100.00 (default)
-
-
Subtotal
23,560
0.05%
2.07%
1.25
382
1.62%
Institutions
0.00 to < 0.15
16,715
0.04%
24.33%
1.58
1,762
10.54%
0.15 to < 0.25
-
-
0.25 to < 0.50
1,475
0.26%
26.20%
1.92
505
34.23%
0.50 to < 0.75
717
0.50%
37.67%
1.47
412
57.56%
0.75 to < 2.50
375
1.52%
41.49%
1.59
358
95.35%
2.50 to < 10.00
336
3.74%
33.75%
1.13
270
80.24%
10.00 to < 100.00
48
13.49%
28.36%
2.18
71
149.52%
100.00 (default)
2
100.00%
35.00%
4.03
8
437.50%
Subtotal
19,667
0.21%
25.43%
1.59
3,386
17.22%
Corporate
0.00 to < 0.15
37,109
0.06%
33.89%
1.34
5,229
14.09%
0.15 to < 0.25
44
0.20%
12.27%
2.28
5
10.66%
0.25 to < 0.50
4,004
0.26%
30.72%
2.40
1,561
38.98%
0.50 to < 0.75
4,205
0.50%
24.66%
2.43
1,454
34.59%
0.75 to < 2.50
5,334
1.49%
28.94%
2.86
3,704
69.43%
2.50 to < 10.00
2,602
4.53%
31.11%
1.80
2,583
99.27%
10.00 to < 100.00
397
14.08%
31.56%
2.88
571
143.97%
100.00 (default)
296
100.00%
29.82%
2.48
527
177.89%
Subtotal
53,991
1.11%
32.25%
1.69
15,634
28.96%
Retail
0.00 to < 0.15
-
-
0.15 to < 0.25
113
0.20%
11.50%
5.00
6
4.94%
0.25 to < 0.50
6
0.34%
46.00%
5.00
2
27.90%
0.50 to < 0.75
0
0.53%
28.75%
5.00
0
22.64%
0.75 to < 2.50
-
-
2.50 to < 10.00
-
-
10.00 to < 100.00
1
24.71%
24.00%
5.00
0
61.40%
100.00 (default)
-
-
Subtotal
121
0.36%
13.40%
5.00
8
6.56%
TOTAL
97,340
0.67%
23.55%
1.57
19,411
19.94%
(1)PD taking into account substitution and reduction effects as at 31 December 2020.
(In EURm)
31.12.2021
Risk weight
Exposure
Classes
0%
2%
4%
10%
20%
50%
70%
75%
100%
150%
Others
Total
exposure
value
Central governments
or central banks172
-
-
-
-
-
-
-
4
-
-
176
Regional government or local authorities
-
-
-
-
-
-
-
-
-
-
-
-
Public sector entities
-
-
-
-
83
0
-
-
28
-
0
112
Multilateral development banks
-
-
-
-
-
-
-
-
0
-
-
0
International organisations
-
-
-
-
-
-
-
-
-
-
-
-
Institutions
22,466
13,767
0
-
1,485
373
-
-
156
-
4
38,251
Corporates
-
74
-
-
-
40
-
-
4,032
-
1
4,147
Retail
-
-
-
-
-
-
-
23
0
-
0
23
Institutions and corporates with
a short-term credit assessment-
-
-
-
-
-
-
-
-
-
-
-
Other items
-
-
-
-
-
-
-
-
-
1
0
1
TOTAL
22,638
13,841
0
-
1,568
413
-
23
4,220
1
5
42,710
(In EURm)
31.12.2020
Risk weight
Exposure
Classes
0%
2%
4%
10%
20%
35%
50%
70%
75%
100%
150%
250%
370%
1,250%
Others
RW
Total
Central governments
or central banks170
-
-
-
-
-
-
-
-
-
-
-
-
-
-
170
Regional governments or local authorities
0
-
-
-
-
-
-
-
-
-
-
-
-
-
0
0
Public sector entities
-
-
-
-
2
-
-
-
-
1
-
-
-
-
-
3
Multilateral Development Banks
-
-
-
-
-
-
-
-
-
-
-
-
-
-
-
-
International Organisations
-
-
-
-
-
-
-
-
-
-
-
-
-
-
-
-
Institutions
8,435
12,033
0
-
2,687
-
278
-
-
483
1
-
-
-
9
23,925
Corporates
-
-
-
-
0
-
22
-
-
1,193
0
-
-
-
183
1,398
Retail
-
-
-
-
-
-
-
-
1
1
-
-
-
-
0
2
Secured by mortgages on immovable property
-
-
-
-
-
-
-
-
-
-
-
-
-
-
-
-
Exposures
in default-
-
-
-
-
-
-
-
-
-
0
-
-
-
0
0
Items associated with particularly high risk
-
-
-
-
-
-
-
-
-
-
0
-
-
-
-
0
Covered bonds
-
-
-
-
-
-
-
-
-
-
-
-
-
-
-
-
Claims on institutions
and corporates with a short-term credit assessment-
-
-
-
-
-
-
-
-
-
-
-
-
-
-
-
Collective investments undertakings (CIU)
-
-
-
-
-
-
-
-
-
-
-
-
-
-
-
-
Equity exposures
-
-
-
-
-
-
-
-
-
-
-
-
-
-
-
-
Other exposures
-
-
-
-
-
-
-
-
-
-
-
-
-
-
-
-
TOTAL
8,605
12,033
0
-
2,688
-
300
-
1
1,678
1
-
-
-
192
25,497
(In EURm)
31.12.2021
Credit derivative hedges
Protection bought
Protection sold
Notionals
Single-name credit default swaps
40,954
53,351
Index credit default swaps
27,164
22,736
Total return swaps
3,059
-
Credit options
734
954
Other credit derivatives
10,519
3,326
TOTAL NOTIONALS
82,429
80,366
Fair values
Positive fair value (asset)
374
2,105
Negative fair value (liability)
(2,100)
(420)
IMM is the internal model method applied to calculate exposures to counterparty credit risk. The banking models used are subject to approval of the supervisor.
The application of these internal models has an impact on the method used to calculate the EAD of market transactions but also on the Basel maturity calculation method.
(In EURm)
RWA
RWA as at end of previous reporting period (30.09.2021)
15,039
Asset size
(879)
Credit quality of counterparties
(32)
Model updates (IMM only)
(1,100)
Methodology and policy (IMM only)
-
Acquisitions and disposals
-
Foreign exchange movements
175
Other
-
RWA as at end of reporting period (31.12.2021)
13,203
-
8 SECURITISATION
This section provides information on Societe Generale’s securitisation positions, which have already been incorporated into the relevant sections (credit risk and market risk).
They are subject to specific capital requirements according to European regulations.
Regulatory capital requirements for securitisations in the Banking Book at end 2021
EUR 509m
(Amount at end 2020: EUR 439m)
Regulatory capital requirements for securitisations in the Trading Book at end 2021
EUR 45m
(Amount at end 2020: EUR 43m)
-
8.1 SECURITISATIONS AND REGULATORY FRAMEWORK
This section presents information on Societe Generale’s securitisation activities, acquired or carried out for proprietary purposes or for its customers. It describes the risks associated with these activities and the management of those risks. Finally, it contains quantitative information to describe these activities during 2021, as well as the capital requirements for the Group’s regulatory banking book and trading book within the scope defined by prudential regulations.
As defined in prudential regulations, the term securitisation refers to a transaction or scheme, whereby the credit risk associated with an exposure or pool of exposures is divided into tranches, having the following characteristics :
■payments in the transaction or scheme are contingent on the performance of the exposure or pool of exposures;
■subordination of some tranches determines the distribution of losses during the ongoing life of the transaction or risk transfer scheme.
■in Regulation (EU) No 2017/2401 amending Regulation (EU) No 575/2013 relating to the capital requirements applicable to credit institutions and to credit and investment firms;
■in Regulation (EU) No 2017/2402 creating a general framework for securitisation as well as a specific framework for simple, transparent, and standardised securitisations (STS).
Regulation No 2017/2401 presents the hierarchy of methods for weighting securitisation positions (see section 8.6). The floor weighting rate is 15% (10% for STS securitisations).
Regulation No 2017/2402 defines the criteria for the identification of “simple, transparent and standardised” (STS) securitisations to which specific and lower capital charges are applicable. The text also specifies the authorisation procedure for third-party organisations that will be involved in ensuring compliance with requirements relating to STS securitisations. The risk retention requirement for the transferor is set at a minimum level of 5%.
■regulation (EU) 2021/557 amending regulation (EU) 2017/2402 and creating a specific STS framework for synthetic on-balance sheet securitisations;
■regulation (EU) 2021/558 amending regulation (EU) no 575/2013, a specific prudential framework for non-performing exposures (NPE) securitisations.
-
8.2 ACCOUNTING METHODS
The securitisation transactions that Societe Generale invests in (i.e. the Group invests directly in certain securitisation positions, is a liquidity provider or a counterparty of derivative exposures) are recognised in accordance with Group accounting principles, as set forth in the notes to the consolidated financial statements included in the 2021 Universal Registration Document.
In the financial statements, the classification of securitisation positions depends on their contractual characteristics and the way the entity manages those financial instruments.
When analysing the contractual cash flow of financial assets issued by a securitisation vehicle, the entity must analyse the contractual terms, as well as the credit risk of each tranche and the exposure to credit risk in the underlying pool of financial instruments. To that end, the entity must apply a “look-through approach” to identify the underlying instruments that are creating the cash flows.
Contractual flows that represent solely payments of principal and interest on the principal amount outstanding are consistent with a basic lending arrangement (SPPI flows: Solely Payments of Principal and Interest).
In the financial statements, the basic securitisation positions (SPPI) are classified into two categories, depending on the business model used to managed them:
■when they are managed under a “Collect and Sell” business model, the positions are classified as “Financial assets at fair value through other comprehensive income”. Accrued or earned income on these positions is recorded in profit or loss based on the effective interest rate, under Interest and similar income. At the reporting date, these instruments are measured at fair value, and changes in fair value, excluding income, are recorded under Unrealised or deferred gains and losses. Furthermore, as these financial assets are subject to impairment for credit risk, changes in expected credit losses are recorded in profit or losses under Cost of risk with a corresponding entry to Unrealised or deferred gains and losses;
■when they are managed under a “Hold to Collect” business model, the positions are measured at amortised cost. Subsequent to initial recognition, these positions are measured at amortised cost using the effective interest method, and their accrued or earned income is recorded in the income statement under Interest and similar income. Furthermore, as these financial assets are subject to impairment for credit risk, changes in expected credit losses are recorded in profit or loss under Cost of risk with a corresponding impairment of amortised cost under balance sheet assets.
The securitisation positions that are not basic (non–SPPI) will be measured at fair value through profit or loss, regardless of the business model for managing them.
At the balance sheet date, these assets are recorded in the balance sheet under Financial assets at fair value through profit or loss and changes in the fair value of these instruments (excluding interest income) are recorded in the income statement under Net gains or losses on financial instruments at fair value through profit or loss.
Interest income and expense are recorded in the income statement under Interest and similar income and Interest and similar expense.
Securitisation positions classified among the financial assets at amortised cost or among the financial assets at fair value through other comprehensive income, are systematically subject to impairment or a loss allowance for expected credit losses. These impairments and loss allowances are booked on initial recognition of the assets, without waiting for objective evidence of impairment to occur.
To determine the amount of impairment to be recorded at each reporting date, these assets are classified into one of three categories based on the increase in credit risk observed since initial recognition. Stage 1 exposures are impaired for the amount of credit losses that the Group expects to incur within 12 months; Stages 2 and 3 exposures are impaired for the amount of credit losses that the Group expects to incur over the life of the exposures.
For securitisation positions measured at fair value through profit or loss, their fair value includes already the expected credit loss, as assessed by the market participant, on the residual lifetime of the instrument.
Reclassification of securitisation positions is only required in the exceptional event that the Group changes the business model used to manage these assets.
Synthetic securitisations in the form of Credit Default Swaps follow accounting recognition rules specific to trading derivatives.
The securitisation transactions are derecognised when the contractual rights to the cash flows on the asset expire or when the Group has transferred the contractual rights to receive the cash flows and substantially all the risks and rewards linked to the ownership of the asset. Where the Group has transferred the cash flows of a financial asset but has neither transferred nor retained substantially all the risks and rewards of its ownership and has effectively not retained control of the financial asset, the Group derecognises it and, where necessary, recognises a separate asset or liability to cover any rights and obligations created or retained because of transferring the asset. If the Group has retained control of the asset, it continues to recognise it in the balance sheet to the extent of its continuing involvement in that asset.
Securitisation of securitised assets recognised in the Group balance sheet follow the same accounting treatment described above.
When a financial asset is derecognised in its entirety, a gain or loss on disposal is recorded in the income statement for an amount equal to the difference between the carrying value of the asset and the payment received for it, adjusted where necessary for any unrealised profit or loss previously recognised directly in equity.
-
8.3 STRUCTURED ENTITIES’ SPECIFIC CASE
A structured entity is an entity that has been designed so that voting or similar rights are not the dominant factor in deciding who controls the entity.
When assessing the existence of a control over a structured entity, all facts and circumstances shall be considered, among which:
■the structuring of the entity (especially, the power to direct the relevant activities of the entity);
■risks to which the entity is exposed by way of its design and the Group’s exposure to some or all of these risks;
Within the framework of the consolidation of structured entities that are controlled by the Group, the shares of those entities that are not held by the Group are recognised under “Debt” in the balance sheet.
-
8.4 MANAGEMENT OF SECURITISATION RISKS
The management of risks associated with securitisation operations follows the rules established by the Group depending on whether these assets are recorded in the banking book (credit and counterparty credit risks) or in the trading book (market risk and counterparty credit risk).
The securitisation risk is monitored by the Client Relations and Financing and Advisory Solutions department (Global Banking & Advisory - GLBA) and, in respect of transactions for own account, by the Group Treasury Department of the Financial Department [DFIN / GTR / FUN] in LoD1 and supervised in the credit risk management system by the “Corporate and Investment Banking” division (CIB) of the Risks department in LoD2.
As a rule, only the Asset-Backed Products division of GLBA has the mandate to deal with transactions generating securitisation risk.
■structuring and/or primary distribution of ABS (Asset-Backed Securities), which can take the form of RMBS (Residential Mortgage-Backed Securities), CMBS (Commercial Mortgage-Backed Securities) and CLOs (Collateralised Loan Obligations), structured or co-arranged by Societe Generale, for the benefit of issuers (companies and specialised financial companies) also called “public securitisation”. These transactions do not generate any securitisation risk for the Group if no exposure is retained by Societe Generale;
■financing of customer needs, via commercial paper backed by assets issued by Societe Generale conduits or, marginally, on the balance sheet, also called “private securitisation”. These activities generate credit risk for Societe Generale and are overseen by the “Corporate and Investment Banking” (CIB) division of the Risk Department;
■structuring of securitisation transactions for its own (i.e., the underlying portfolio consisting of receivables booked on the Group’s balance sheet). This activity does not generate additional credit risk for the Group; the role of the Corporate and Investment Banking (CIB) division of the Risk Department [RISQ / CIB] is to ensure that the structure is robust;
■securitised products are also used as underlying on the secondary market in collateralised financing and trading transactions. These transactions generate both credit risk and market risk for the Group and are overseen by the “Corporate and Investment Banking” (CIB) and the Risks on Market Activities and ALM divisions of the Risk Department.
The Risk Department, within the framework of various CORISQs chaired by General Management and in compliance with the risk appetite of Societe Generale group, formalises, jointly with the “Global Banking and Advisory” department, the Group’s risk appetite with regard to securitisation activities.
These frameworks are established by type of product (primary securitisation, sale of securitisation products in secondary, collateralised financing, etc.) and aim to define the acceptable level of risk with regard to the Group’s strategic objectives via limits and guidelines for granting credit.
The role and responsibilities of the Risk Department are divided according to the main risk (credit or market).
The Risk Department contributes to the definition of risk policies, taking into account the objectives of the business lines and the corresponding risk issues.
The Risk Department defines or validates the methods and procedures for analysing, measuring, approving and monitoring risks and, ultimately, ensures that they are in line with the needs of the businesses.
The Risk Department validates the operations and certain limits, the others being presented in CORISQ.
In the same way as for all structured finance transactions, the Business Unit has no delegation of signature for securitisation transactions. Any securitisation transaction must be validated by the Risk Department.
Securitisation exposures subject to credit risk are approved through the Group’s standard credit approval process. New operations are presented by the business lines (LoD1) to the Risk Department, after approval by the business line manager. The Risk Department gives its opinion on these new transactions, which are approved according to the delegations in force. All exhibitions are subject to an annual review by the business line and the Risk Department.
The rating of the transaction and the borrower as well as the LGD are therefore subject to an initial validation and an annual review for each transaction. In particular, the data used within the framework of the IAA (Internal Assessment Approach) securitisation model and the result of the calculations of this model are subject to specific validation. Regular monitoring is carried out independently of the business line and portfolio reviews are produced quarterly specifically on the bank’s securitisation exposures. This monitoring makes it possible to identify any changes in the behaviour of securitised assets.
Portfolio-level limits are granted by the Risk Committee for securitisation exposures. Stress tests are also carried out on these portfolios.
The analysis of the credit risk of securitisation transactions covers the standard elements of credit risk: the performance of the underlying assets as well as that of the assignor/collector. Risk factors are reduced by structural elements of each transaction including default triggers, excess spread, delinquencies, segregated accounts and back-up collector. The monitoring of the credit risk on these transactions, of the performance of the underlying assets and of the covenants, is reviewed at portfolio level by the “Corporate and Investment Banking” division of the Risks department. each quarter during the Quarterly Portfolio Review prepared by the “Global Business Service Unit” with a focus on major events and sent to the “Corporate and Investment Banking” division of the Risk Department with a presentation in session every other quarter. A follow-up at the level of each transaction is carried out in detail each year during the Annual Review with a revalidation of the rating of the transaction.
Securitisation exposures subject to market risk are monitored and controlled through Societe Generale’s market risk standard market approval process, with additional controls specific to securitisation.
The analysis of the market risk of securitisation transactions covers the standard elements of market risk: credit, spread, liquidity risk, interest rate risk (hedged with standard liquid interest rate instruments (US Treasuries, Eurodollar futures, interest rate swaps)).
Securitisation exposures are subject to strict supervision through the setting of limits on specific assets in the securitisation field (CMBS, CLO, RMBS, ABS), according to several types of indicators:
■Value at risk (VaR) and Stressed value at risk (SVaR): synthetic indicators, allowing day-to-day monitoring of market risk;
■stress test measurements, based on ten-year risk type indicators. These metrics make it possible to limit the Group’s exposure to systemic risks and cases of exceptional market shocks impacting securitisation activities;
■other specific indicators: nominal limits on the sizes of ABS market-making inventories, cash at risk and stress test limits on financing activities collateralised by ABS, which makes it possible in particular to monitor the behaviour of the underlying assets under stress and supervise the Group’s exposure in the event of market shocks.
The Risk Department on Market Operations is in charge of examining limit requests made by the front office. These limits make it possible to ensure that the Group respects the appetite for the market validated by the Board of Directors, on a proposal from General Management.
The daily monitoring of compliance with the limits by the front office is carried out by the Risk Department on market transactions. This continuous monitoring of the risk profile is the subject of frequent exchanges between the risk and business teams, which may result in various positions hedging actions by the front office aimed at reducing the level of risk of complying with the framework defined. In the event of an overrun, the front office must detail the reasons for the management concerned, and take the necessary measures to return to the defined framework, or otherwise request a temporary or permanent increase in the limit if customer demand, market conditions or risk assessment justify it.
The management of structural interest rate and change risks in securitisation activities does not differ from that of other Group assets.
The liquidity risk linked to securitisation activities is monitored both at the level of the responsible business lines but also, centrally, at the level of the Finance Department, with in particular the measurement of the impact of these activities on liquidity ratios, stress tests and the Group’s liquidity gaps. The organisation and management of liquidity risk are covered in Chapter 12 of this document.
The monitoring of operational risk on securitisation activities is taken into account in the Group’s operational risk management systems. Thus, the operational risks on these activities are notably regulated by the limits of the appetite for operational risk, identified and assessed by the Risk Control Self-Assessment exercise and any incidents are collected and analysed according to Group standards. The management of operational risk is described in Chapter 10 of this document.
-
8.5 SOCIETE GENERALE’S SECURITISATION ACTIVITIES
Securitisation activities allow the Group to raise liquidity or manage risk exposures, for proprietary purposes or on behalf of customers. Within the framework of these activities, the Group can act as originator, sponsor/arranger or investor:
■as an originator, the Group directly or indirectly participates in the initial agreement on assets which subsequently serve as underlying in securitisation transactions, primarily for refinancing purposes;
■as a sponsor, the Group establishes and manages a securitisation programme used to refinance customers’ assets, mainly via the Antalis and Barton conduits and via certain other special purpose vehicles;
■as an investor, the Group invests directly in certain securitisation positions, is a liquidity provider or a counterparty of derivative exposures.
This information must be considered within the context of the specific structure of each transaction and vehicle, which cannot be described in this report.
Securitisation initiatives are part of the portfolio management program. They are efficient tools for optimizing capital management and managing credit risk exposure while maintaining a strong level of commercial dynamic. Several transactions with significant risk transfer (SRT) have been executed since mid-2019, mostly under a synthetic format and on different portfolios, to manage underlying credit risks and associated capital requirement. The SRT policy is documented in terms of internal governance, control framework as well as ongoing monitoring and reporting.
Taken separately, the level of payments past due or in default does not provide sufficient information on the types of exposures securitised by the Group, mainly because the default criteria may vary from one transaction to another. Furthermore, these data reflect the situation of the underlying assets.
In securitisation transactions, past due exposures are generally managed via structural mechanisms that protect the most senior positions.
As part of its securitisation activities, the Group does not provide any implicit support in accordance with Article 250 of revised CRR (regulation (UE) 2017/2401).
Since the protection purchased is financed, there is no counterparty credit risk on the vendor of the insurance. The Group does not intend to purchase unfunded protection at this stage.
As part of its refinancing activities, the Group undertakes securitisations of some of its portfolios of receivables originated with individuals or corporate customers. The securities created in these transactions can be either sold to external investors, thus providing funding to the Group, or retained by the Group to be used as collateral in repurchase transactions, notably with the European Central Bank.
■EUR 1.0 billion securitisation of auto loans in Italy, publicly placed to provide external funding of EUR 0.995 billion and reduce RWA consumption;
■EUR 1.0 billion securitisation of auto lease receivables in Germany, publicly placed to provide external funding of EUR 0.995 billion of funding and reduce RWA consumption;
■several EUR 1 billion securitisation transactions of auto lease receivables originating from long term lease contract, and publicly placed for EUR 0.8 billion.
Given that there is no significant risk transfer as regards the Group securitisation transactions on its funding, those transactions have no impact on the Group’s regulatory capital, and consequently are not included in the tables of this section.
The vehicules bearing the transferred receivables are consolidated by the Group. This last one remains exposed to most of the risks and advantages on these receivables. Moreover, they cannot be used as guarantee or collateral or sold within the framework of other operations.
The total outstanding of the receivables securitised without significant risk transfer amounted to EUR 13.3 billion as at 31 December 2021, including EUR 4.3 billion of French home loans, EUR 5.6 billion of German auto loans, EUR 3.3 billion of French consumer loans.
Besides, the Group also detains several synthetic securitisation programmes in which the risk transfer is made by using credit derivatives or financial guarantees and where the portfolio is kept in the balance sheet of the Group.
The securitised stock of these transactions stood at EUR 18.2 billion as at 31 December 2021, mainly composed of loans to corporates.
Societe Generale did not securitise revolving exposures subject to early amortisation treatment in which the level of credit risk to which the originator is exposed may increase following the execution of the early amortisation provision.
The Societe Generale group carries out transactions on behalf of its customers or investors. As at 31 December 2021, there were two consolidated multi-seller vehicles in operation (Barton and Antalis), structured by the Group on behalf of clients. This ABCP (Asset-Backed Commercial Paper) activity funds the working capital requirements of some of the Group’s customers by backing short-term financing with traditional assets such as trade receivables or consumer loans. Total assets held by these vehicles and financed through the issuance of commercial paper amounted to EUR 15.5 billion on 31 December 2021 (EUR 14.4 billion on 31 December 2020).
As part of the implementation of the new IFRS 10 standards on 1 January 2014, Societe Generale has consolidated these two vehicles, Barton and Antalis, from this date onwards.
ABCP activity remained solid in 2021, with newly securitised outstanding amounts predominantly comprising trade receivables, leasing, or consumer loans.
Societe Generale also acts as a market-maker for securitised assets, resulting in securitisation positions in the Group’s trading book. Since 31 December 2011, CRD3 has required the same prudential treatment regardless of prudential classification.
The following tables show the securitisation exposures retained or purchased by the Group, by type of underlying assets, by role and by type of securitisation, etc. Separately for the banking book and for the trading book.
(In EURm)
31.12.2021
Institution acts as originator
Institution acts as sponsor
Institution acts as investor
Traditional
Synthetic
Sub-total
Traditional
Synthetic
Sub-total
Traditional
Synthetic
Sub-total
STS
Non-STS
of
which
SRT
STS
Non-STS
STS
Non-STS
of
which
SRT
of
which
SRT
TOTAL EXPOSURES
2,902
2,902
282
282
14,983
14,983
18,168
4,823
19,828
-
24,651
-
7
-
7
Retail (total)
2,902
2,902
-
-
-
-
2,902
245
11,108
-
11,353
-
0
-
0
Residential mortgage
-
-
-
-
-
-
-
-
-
-
-
-
-
-
-
Credit card
-
-
-
-
-
-
-
-
2,243
-
2,243
-
0
-
0
Other retail exposures
2,902
2,902
-
-
-
-
2,902
245
8,865
-
9,110
-
0
-
0
Re-securitisation
-
-
-
-
-
-
-
-
-
-
-
-
-
-
-
Wholesale (total)
-
-
282
282
14,983
14,983
15,265
4,578
8,720
-
13,298
-
7
-
7
Loans to corporates
-
-
282
282
14,983
14,983
15,265
250
3,888
-
4,138
-
-
-
-
Commercial mortgage
-
-
-
-
-
-
-
-
-
-
-
-
-
-
-
Lease and receivables
-
-
-
-
-
-
-
4,328
3,753
-
8,080
-
7
-
7
Other wholesale
-
-
-
-
-
-
-
-
1,079
-
1,079
-
0
-
0
Re-securitisation
-
-
-
-
-
-
-
-
-
-
-
-
-
-
-
As at end of December 2021, securitisation exposures in the banking book amounted to EUR 42.8 billion. The bulk of the amount consists predominantly of liquidity lines linked to the Group’s sponsor conduit activity. The main underlying assets are corporate loans, consumer loans and trade receivables. In 2021, banking book exposures increased by EUR 3 billion, up 9% year-on-year.
As at 31 December 2021, 80% of banking book securitisation exposures were non-STS. Since 2021, 2 synthetic programmes have been classified as STS in accordance with regulation (EU) 2021/557.
(In EURm)
30.06.2021
Institution acts as originator
Institution acts as sponsor
Institution acts as investor
Traditional
Synthetic
Sub-total
Traditional
Synthetic
Sub-total
Traditional
Synthetic
Sub-total
STS
Non-STS
of
which
SRT
STS
Non-STS
STS
Non-STS
of
which
SRT
of
which
SRT
TOTAL EXPOSURES
1,314
1,314
391
391
14,815
14,815
16,519
4,187
16,149
-
20,336
-
0
-
0
Retail (total)
1,314
1,314
-
-
-
-
1,314
50
9,691
-
9,741
-
0
-
0
Residential mortgage
-
-
-
-
-
-
-
-
-
-
-
-
-
-
-
Credit card
-
-
-
-
-
-
-
-
1,924
-
1,924
-
0
-
0
Other retail exposures
1,314
1,314
-
-
-
-
1,314
50
7,767
-
7,817
-
0
-
0
Re-securitisation
-
-
-
-
-
-
-
-
-
-
-
-
-
-
-
Wholesale (total)
-
-
391
391
14,815
14,815
15,205
4,137
6,458
-
10,594
-
0
-
0
Loans to corporates
-
-
-
-
14,815
14,815
14,815
-
1,727
-
1,727
-
-
-
-
Commercial mortgage
-
-
-
-
-
-
-
-
-
-
-
-
-
-
-
Lease and receivables
-
-
-
-
-
-
-
4,137
3,762
-
7,898
-
-
-
-
Other wholesale
-
-
391
391
-
-
391
-
968
-
968
-
0
-
0
Re-securitisation
-
-
-
-
-
-
-
-
-
-
-
-
-
-
-
(In EURm)
31.12.2021
Institution acts as originator
Institution acts as sponsor
Institution acts as investor
Traditional
Synthetic
Sub-total
Traditional
Synthetic
Sub-total
Traditional
Synthetic
Sub-total
STS
Non-STS
STS
Non-STS
STS
Non-STS
TOTAL EXPOSURES
-
-
-
-
-
-
-
-
41
547
3,621
4,210
Retail (total)
-
-
-
-
-
-
-
-
1
116
41
158
Residential mortgage
-
-
-
-
-
-
-
-
1
115
41
156
Credit card
-
-
-
-
-
-
-
-
-
1
-
1
Other retail exposures
-
-
-
-
-
-
-
-
-
0
-
0
Re-securitisation
-
-
-
-
-
-
-
-
-
-
-
-
Wholesale (total)
-
-
-
-
-
-
-
-
40
431
3,581
4,052
Loans to corporates
-
-
-
-
-
-
-
-
-
204
-
204
Commercial mortgage
-
-
-
-
-
-
-
-
-
88
3,566
3,654
Lease and receivables
-
-
-
-
-
-
-
-
4
5
-
8
Other wholesale
-
-
-
-
-
-
-
-
36
134
15
185
Re-securitisation
-
-
-
-
-
-
-
-
-
-
-
-
The trading book perimeter bears exclusively investor positions for a total of EUR 4.2 billion nominal. Most of the exposure relate to corporate financing, especially on commercial mortgage loans.
For both portfolios, all the re-securitisation has matured. To be noted those exposures were not subject to financial collaterals.
(In EURm)
30.06.2021
Institution acts as originator
Institution acts as sponsor
Institution acts as investor
Traditional
Synthetic
Sub-total
Traditional
Synthetic
Sub-total
Traditional
Synthetic
Sub-total
STS
Non-STS
STS
Non-STS
STS
Non-STS
TOTAL EXPOSURES
-
-
-
-
-
-
-
-
27
456
5,529
6,012
Retail (total)
-
-
-
-
-
-
-
-
15
98
43
156
Residential mortgage
-
-
-
-
-
-
-
-
12
83
43
138
Credit card
-
-
-
-
-
-
-
-
3
-
-
3
Other retail exposures
-
-
-
-
-
-
-
-
-
14
-
14
Re-securitisation
-
-
-
-
-
-
-
-
-
-
-
-
Wholesale (total)
-
-
-
-
-
-
-
-
12
358
5,486
5,856
Loans to corporates
-
-
-
-
-
-
-
-
-
172
-
172
Commercial mortgage
-
-
-
-
-
-
-
-
-
71
5,486
5,556
Lease and receivables
-
-
-
-
-
-
-
-
-
6
-
6
Other wholesale
-
-
-
-
-
-
-
-
12
110
-
122
Re-securitisation
-
-
-
-
-
-
-
-
-
-
-
-
TABLE 83: EXPOSURES SECURITISED BY THE INSTITUTION – EXPOSURES IN DEFAULT AND SPECIFIC CREDIT RISK ADJUSTMENTS (SEC5)
(In EURm)
31.12.2021
Exposures securitised by the institution – Institution acts as originator or as sponsor
Total outstanding nominal amount
Total amount of specific
credit risk adjustments
made during the period
of which exposures in default
TOTAL EXPOSURES
42,818
3,030
5
Retail (total)
14,255
923
5
Residential mortgage
-
-
-
Credit card
2,243
-
-
Other retail exposures
12,012
923
5
Re-securitisation
-
-
-
Wholesale (total)
28,563
2,107
-
Loans to corporates
19,404
2,107
-
Commercial mortgage
-
-
-
Lease and receivables
8,080
-
-
Other wholesale
1,079
-
-
Re-securitisation
-
-
-
(In EURm)
30.06.2021
Exposures securitised by the institution – Institution acts as originator or as sponsor
Total outstanding nominal amount
Total amount of specific
credit risk adjustments
made during the period
of which exposures in default
TOTAL EXPOSURES
36,855
2,003
0
Retail (total)
11,055
654
0
Residential mortgage
-
-
-
Credit card
1,924
-
-
Other retail exposures
9,131
654
0
Re-securitisation
-
-
-
Wholesale (total)
25,800
1,349
-
Loans to corporates
16,542
1,349
-
Commercial mortgage
-
-
-
Lease and receivables
7,898
-
-
Other wholesale
1,359
-
-
Re-securitisation
-
-
-
-
8.6 PRUDENTIAL TREATMENT OF SECURITISATION POSITIONS
Whenever traditional or synthetic securitisations, for which sponsorship, origination, structuring or management of Societe Generale is involved, achieve a substantial and documented risk transfer compliant with the regulatory framework, the underlying assets are excluded from the bank’s calculation of risk-weighted exposures for traditional credit risk.
For the securitisation positions that Societe Generale decides to hold either on- or off-balance sheet, capital requirements are determined based on the bank’s exposure, irrespective of its underlying strategy or role.
Institutions use one of the methods described in the hierarchy below to calculate the weighted exposure amounts:
■when the SEC-SA cannot be used, the institution uses the SEC-ERBA (approach based on external ratings) for positions with an external credit rating or those for which it is possible to infer such a note.
The unrated liquidity lines granted to ABCP programmes can be determined using the Internal Assessment Approach (IAA). Regarding the liquidity lines that the bank grants to the securitisation conduits it sponsors, Societe Generale obtained approval in 2009 to use the internal assessment approach. As such, Societe Generale has developed a rating model (IAA approach), which estimates the expected loss (Expected Loss - EL) for each Group’s exposure to securitisation conduits, which automatically leads to a capital weighting by application of a correspondence table defined by the regulations. The IAA model mainly applies to underlying assets such as trade receivables, auto loans and auto lease. An annual review of the model makes it possible to verify that the performance and conservatism of the model. Also, in-depth analyses are carried out on inputs (transaction details such as default, dilution, or reserve rates), model parameters (transition matrices, PD, LGD) and an EL backtest. The backtest of the outputs themselves being not feasible due to the limited number of transactions, the backtest of the IAA model consists in the backtest of the inputs (including for example default rate and default rate standard deviation) and the parameters as well as a model behavoir analysis. Methodological benchmarks are also regularly carried out in order to validate our internal approach in comparison with the best practices of the market. The relevance of the IAA approach is regularly monitored and reviewed by the Risk Department responsible for Model Risk Management at Group level, as second line of defense. The independent review process ends with (i) review and approval Committees and (ii) an independent review report detailing the scope of the review, the tests performed and their outcomes, the recommendations, and the conclusion of the review. The model control mechanism gives rise to recurrent reporting to the appropriate authorities.
Assets securitised by Societe Generale are usually rated by one or more ECAIs (External Credit Assessment Institutions), the list of which is established by the French prudential supervisory authority ACPR (Autorité de Contrôle Prudentiel et de Résolution). The agencies used are DBRS, FitchRatings, Moody’s Investors Service and Standard & Poor’s. All four rating agencies have been registered with and supervised by the European Securities and Market Authority (ESMA) since 31 October 2011. The capital requirements for securitisation positions valued using the standardised approach are calculated based on the lowest external rating of the securitisation exposure.
An equivalence (see table 29, p. 84) between external ratings and Societe Generale’s internal rating scale is provided, presenting Societe Generale’s internal rating scale and the corresponding scales of the main ECAIs, as well as the corresponding average estimated probabilities of default.
The following tables show the bank’s securitisation exposures and corresponding regulatory capital requirements for the Banking Book as at 31 December 2021.
(In EURm)
31.12.2021
Exposure values
(by RW bands/deductions)
≤ 20%
RW
> 20% to 50%
RW
> 50% to 100%
RW
> 100% to < 1,250%
RW
1,250% RW/
deductions
TOTAL EXPOSURES
42,510
1,261
170
94
43
Traditional transactions
29,174
1,090
170
94
18
Securitisation
29,174
1,090
170
94
18
Retail underlying
13,534
944
-
-
18
of which STS
3,095
-
-
-
18
Wholesale
15,640
146
170
94
-
of which STS
4,807
-
-
-
-
Re-securitisation
-
-
-
-
-
Synthetic transactions
13,336
171
-
-
25
Securitisation
13,336
171
-
-
25
Retail underlying
-
-
-
-
-
Wholesale
13,336
171
-
-
25
Re-securitisation
-
-
-
-
-
(In EURm)
31.12.2021
Exposure values
(by regulatory approach)
RWA
(by regulatory approach)
Capital charge
after cap
SEC-IRBA
SEC-ERBA
(including
IAA)
SEC-SA
1,250%/
deductions
SEC-IRBA
SEC-ERBA
(including
IAA)
SEC-SA
1,250%/
deductions
SEC-IRBA
SEC-ERBA
(including
IAA)
SEC-SA
1,250%/
deductions
TOTAL EXPOSURES
14,988
25,631
3,416
43
2,082
3,977
308
-
167
318
25
-
Traditional transactions
1,481
25,631
3,416
18
89
3,977
308
-
7
318
25
-
Securitisation
1,481
25,631
3,416
18
89
3,977
308
-
7
318
25
-
Retail underlying
912
11,204
2,363
18
-
1,887
59
-
-
151
5
-
of which STS
912
90
2,093
18
-
12
13
-
-
1
1
-
Wholesale
570
14,427
1,053
-
89
2,090
249
-
7
167
20
-
of which STS
-
4,807
-
-
-
486
-
-
-
39
-
-
Re-securitisation
-
-
-
-
-
-
-
-
-
-
-
-
Synthetic transactions
13,507
-
-
25
1,993
-
-
-
159
-
-
-
Securitisation
13,507
-
-
25
1,993
-
-
-
159
-
-
-
Retail underlying
-
-
-
-
-
-
-
-
-
-
-
-
Wholesale
13,507
-
-
25
1,993
-
-
-
159
-
-
-
Re-securitisation
-
-
-
-
-
-
-
-
-
-
-
-
Most of the STS EAD transactions of the banking book (EUR 9.4 billion) are in IAA methodology (SG sponsor EUR 4.9 billion) and in SEC-IRBA methodology (SG originator EUR 2.4 billion).
(In EURm)
30.06.2021
Exposure values
(by RW bands/deductions)
≤ 20%
RW
> 20% to 50%
RW
> 50% to 100%
RW
> 100% to < 1,250%
RW
1,250% RW/
deductions
TOTAL EXPOSURES
37,469
1,326
167
90
68
Traditional transactions
24,126
1,326
167
90
10
Securitisation
24,126
1,326
167
90
10
Retail underlying
10,701
1,028
-
-
10
of which STS
1,356
-
-
-
10
Wholesale
13,425
299
167
90
-
of which STS
4,599
-
-
-
-
Re-securitisation
-
-
-
-
-
Synthetic transactions
13,343
-
-
-
58
Securitisation
13,343
-
-
-
58
Retail underlying
-
-
-
-
-
Wholesale
13,343
-
-
-
58
Re-securitisation
-
-
-
-
-
(In EURm)
30.06.2021
Exposure values
(by regulatory approach)
RWA
(by regulatory approach)
Capital charge
after cap
SEC-IRBA
SEC-ERBA
(including
IAA)
SEC-SA
1,250%/
deductions
SEC-IRBA
SEC-ERBA
(including
IAA)
SEC-SA
1,250%/
deductions
SEC-IRBA
SEC-ERBA
(including
IAA)
SEC-SA
1,250%/
deductions
TOTAL EXPOSURES
13,854
22,543
2,655
68
2,003
3,483
333
-
160
279
27
-
Traditional transactions
511
22,543
2,655
10
73
3,483
333
-
6
279
27
-
Securitisation
511
22,543
2,655
10
73
3,483
333
-
6
279
27
-
Retail underlying
-
10,153
1,575
10
-
1,712
46
-
-
137
4
-
of which STS
-
51
1,305
10
-
5
-
-
-
0
-
-
Wholesale
511
12,390
1,079
-
73
1,771
287
-
6
142
23
-
of which STS
-
4,599
-
-
-
465
-
-
-
37
-
-
Re-securitisation
-
-
-
-
-
-
-
-
-
-
-
-
Synthetic transactions
13,343
-
-
58
1,930
-
-
-
154
-
-
-
Securitisation
13,343
-
-
58
1,930
-
-
-
154
-
-
-
Retail underlying
-
-
-
-
-
-
-
-
-
-
-
-
Wholesale
13,343
-
-
58
1,930
-
-
-
154
-
-
-
Re-securitisation
-
-
-
-
-
-
-
-
-
-
-
-
(In EURm)
31.12.2021
Exposure values
(by RW bands/deductions)
≤ 20%
RW
> 20% to 50%
RW
> 50% to 100%
RW
> 100% to < 1,250%
RW
1,250% RW/
deductions
TOTAL EXPOSURES
7
-
-
0
-
Traditional securitisation
7
-
-
0
-
Securitisation
7
-
-
0
-
Retail underlying
0
-
-
0
-
of which STS
-
-
-
-
-
Wholesale
7
-
-
0
-
of which STS
-
-
-
-
-
Re-securitisation
-
-
-
-
-
Synthetic securitisation
-
-
-
-
-
Securitisation
-
-
-
-
-
Retail underlying
-
-
-
-
-
Wholesale
-
-
-
-
-
Re-securitisation
-
-
-
-
-
(In EURm)
31.12.2021
Exposure values
(by regulatory approach)
RWA
(by regulatory approach)
Capital charge
after cap
SEC-IRBA
SEC-ERBA
(including
IAA)
SEC-SA
1,250%/
deductions
SEC-IRBA
SEC-ERBA
(including
IAA)
SEC-SA
1,250%/
deductions
SEC-IRBA
SEC-ERBA
(including
IAA)
SEC-SA
1,250%/
deductions
TOTAL EXPOSURES
-
7
-
-
-
2
-
-
-
0
-
-
Traditional securitisation
-
7
-
-
-
2
-
-
-
0
-
-
Securitisation
-
7
-
-
-
2
-
-
-
0
-
-
Retail underlying
-
0
-
-
-
0
-
-
-
0
-
-
of which STS
-
-
-
-
-
-
-
-
-
-
-
-
Wholesale
-
7
-
-
-
1
-
-
-
0
-
-
of which STS
-
-
-
-
-
-
-
-
-
-
-
-
Re-securitisation
-
-
-
-
-
-
-
-
-
-
-
-
Synthetic securitisation
-
-
-
-
-
-
-
-
-
-
-
-
Securitisation
-
-
-
-
-
-
-
-
-
-
-
-
Retail underlying
-
-
-
-
-
-
-
-
-
-
-
-
Wholesale
-
-
-
-
-
-
-
-
-
-
-
-
Re-securitisation
-
-
-
-
-
-
-
-
-
-
-
-
(In EURm)
30.06.2021
Exposure values
(by RW bands/deductions)
≤ 20%
RW
> 20% to 50%
RW
> 50% to 100%
RW
> 100% to < 1,250%
RW
1,250% RW/
deductions
TOTAL EXPOSURES
0
-
-
0
-
Traditional securitisation
0
-
-
0
-
Securitisation
0
-
-
0
-
Retail underlying
0
-
-
0
-
of which STS
-
-
-
-
-
Wholesale
-
-
-
0
-
of which STS
-
-
-
-
-
Re-securitisation
-
-
-
-
-
Synthetic securitisation
-
-
-
-
-
Securitisation
-
-
-
-
-
Retail underlying
-
-
-
-
-
Wholesale
-
-
-
-
-
Re-securitisation
-
-
-
-
-
(In EURm)
30.06.2021
Exposure values
(by regulatory approach)
RWA
(by regulatory approach)
Capital charge
after cap
SEC-IRBA
SEC-ERBA
(including
IAA)
SEC-SA
1,250%/
deductions
SEC-IRBA
SEC-ERBA
(including
IAA)
SEC-SA
1,250%/
deductions
SEC-IRBA
SEC-ERBA
(including
IAA)
SEC-SA
1,250%/
deductions
TOTAL EXPOSURES
-
0
-
-
-
0
-
-
-
0
-
-
Traditional securitisation
-
0
-
-
-
0
-
-
-
0
-
-
Securitisation
-
0
-
-
-
0
-
-
-
0
-
-
Retail underlying
-
0
-
-
-
0
-
-
-
0
-
-
of which STS
-
-
-
-
-
-
-
-
-
-
-
-
Wholesale
-
0
-
-
-
0
-
-
-
0
-
-
of which STS
-
-
-
-
-
-
-
-
-
-
-
-
Re-securitisation
-
-
-
-
-
-
-
-
-
-
-
-
Synthetic securitisation
-
-
-
-
-
-
-
-
-
-
-
-
Securitisation
-
-
-
-
-
-
-
-
-
-
-
-
Retail underlying
-
-
-
-
-
-
-
-
-
-
-
-
Wholesale
-
-
-
-
-
-
-
-
-
-
-
-
Re-securitisation
-
-
-
-
-
-
-
-
-
-
-
-
Business Line
Originator
SSPE
Description of types
of institution’s exposures
to those SSPEs
IBFS
BANK DEUTSCHES KRAFTFAHRZEUGGEWERBE GMBH (BDK)
RED & BLACK AUTO GERMANY 6 UG
Auto loans. SG or an affiliate of the Group may provide cash reserves to the SSPE in certain circumstances and hold the junior tranches.
BANK DEUTSCHES KRAFTFAHRZEUGGEWERBE GMBH (BDK)
RED & BLACK AUTO GERMANY 7 UG
Auto loans. SG or an affiliate of the Group may provide cash reserves to the SSPE in certain circumstances and hold the junior tranches.
BANK DEUTSCHES KRAFTFAHRZEUGGEWERBE GMBH (BDK)
RED & BLACK AUTO GERMANY 8 UG
Auto loans. SG or an affiliate of the Group may provide cash reserves to the SSPE in certain circumstances and hold the junior tranches.
FIDITALIA SPA
RED & BLACK AUTO ITALY SRL
Auto loans. SG or an affiliate of the Group may provide cash reserves to the SSPE in certain circumstances and hold the junior tranches.
List of SSPEs and other legal entities for which the institutions provide securitisation-related services, such as advisory, asset servicing or management services:
On SGSS side, other asset managers are providing different categories of funds other that securitisation.
List of legal entities affiliated with the institutions and that invest in securitisations originated by the institutions or in securitisation positions issued by SSPEs sponsored by the institutions:
Country
Legal entities affiliated
Germany
BANK DEUTSCHES KRAFTFAHRZEUGGEWERBE GMBH (BDK)
Spain
SOCGEN FINANCIACIONES IBERIA, S.L.
France
SOCIETE GENERALE
SOGELEASE FRANCE
Hong Kong
SG ASSET FINANCE (HONG KONG) LIMITED
Ireland
SGBT FINANCE IRELAND DESIGNATED ACTIVITY COMPANY
Italy
FIDITALIA SPA
Luxembourg
SGBTCI
SGBT ASSET BASED FUNDING SA
-
9 MARKET RISK
Market risk is the risk of loss of value on financial instruments arising from changes in market parameters, the volatility of these parameters and the correlations between them. These parameters include, but are not limited to, exchange rates, interest rates, the price of securities (equities or bonds), commodities, derivatives and other assets.
Market risk RWA at end 2021
EUR 11.6bn
(Amount at end 2020: EUR 15.3bn)
Annual average VaR
(1 day, 99%) - 2021EUR 15m
(Annual average VaR 2020: EUR 33m)
Share of RWA calculated via the internal model
88%
Market risk is the risk of loss of value on financial instruments arising from changes in market parameters, the volatility of these parameters, and the correlations between them. These parameters include, but are not limited to, exchange rates, interest rates, the price of securities (equities or bonds), commodities, derivatives and other assets.
-
9.1 ORGANISATION OF MARKET RISK MANAGEMENT
Although primary responsibility for managing risk exposure relies on the front office managers, the supervision system comes under the Market Risk Department of the Risk Division, which is independent from the businesses.
■the proposal of appropriate market risk limits by Group activity to the Group Risk Committee (CORISQ);
■the assessment of the limit requests submitted by the different businesses within the framework of the overall limits authorised by the Board of Directors and General Management, and based on the use of these limits;
■the permanent verification of the existence of an effective market risk monitoring framework based on suitable limits;
■the daily calculation and certification of the market risk indicators, of the P&L resulting from market activities, based on formal and secure procedures, and then of the reporting and the analysis of these indicators;
In order to perform its tasks, the department also defines the architecture and the functionalities of the information system used to produce the risk and P&L indicators for market transactions, and ensures it meets the needs of the different businesses and of the Market Risk Department.
This department contributes to the detection of possible rogue trading operations through a monitoring mechanism based on alert levels (on gross nominal value of positions for example) applied to all instruments and desks.
■the Risk Committee of the Board of Directors(1) is informed of the Group’s major market risks; in addition, it issues a recommendation on the most substantial proposed changes in terms of market risk measurement and framework (after prior approval by the CORISQ); this recommendation is then referred to the Board of Directors for a decision;
■the Group Risk Committee(2) (CORISQ), chaired by the Chief Executive Officer of the Group, is regularly informed of Group-level market risks. Moreover, upon a proposal from the Risk Department, it validates the main choices with regard to market risk measurement, as well as the key developments on the architecture and implementation of the market risk framework at Group level;
■the market risks related to the Global Markets Division are reviewed during the Market Risk Committee(3) (MRC) led by the Market Risk Department and co-chaired by the Risk Division and by the Global Markets Division. This Committee provides information on risk levels for the main risk indicators as well as for some specific activities pointed out depending on market or business driven events. It also provides an opinion on the market risk framework changes falling under the remit of the Risk Division and Global Markets Division.
During these Committees, the market activities P&L and several metrics for monitoring market risks are systematically reported:
In addition to these Committees, detailed and summary market risk reports, produced on a daily, weekly, monthly or quarterly basis, either related to various Group levels or geographic areas, are sent to the relevant business line and risk function managers.
In terms of governance, within the Market Risk Department, the main functional and transversal subjects are dealt with during Committees organised by value chains (market risk, P&L, etc.). These Committees are decision-making bodies, composed of senior representatives from each relevant Department teams and regions.
-
9.2 MARKET RISK MONITORING PROCESS
The business development strategy of the Group for market activities is primarily focused on meeting client needs, with a full range of products and solutions. The risk resulting from these market activities is strictly managed through a set of limits for several indicators:
■the Value-at-Risks (VaR) and stressed Value-at-Risks (sVaR): these global indicators are used for market risk calculations for RWA and for the day-to-day monitoring of the market risks incurred by the Group within the scope of its trading activities;
■stress test measurements, based on decennial shock-type indicators, which make it possible to restrict the Group’s exposure to systemic risk and exceptional market shocks. These measurements can be global, multi-risk factor (based on historic or hypothetical scenarios), by activity or risk factor in order to take into account extreme risks on a specific market, or event-driven, to temporarily monitor a particular situation;
-sensitivities are used to monitor the risk incurred locally on a given type of position (e.g. sensitivity of an option to changes in the underlying asset),
The Market Risk Department is responsible for the assessment and validation of the limit requests submitted by the different business lines. These limits ensure that the Group complies with the market risk appetite approved by the Board of Directors, further to a proposal from General Management(1).
The choice and calibration of these limits ensure the operational transposition of the Group’s market risk appetite through its organisation:
■their calibration is determined using a detailed analysis of the risks related to the portfolio managed. This analysis may include various elements such as market conditions, specifically liquidity, position maneuverability, risk/rewards analysis, etc.;
■specific limits, or even bans, may be put in place to manage risks for which the Group has little or no risk appetite.
The desk mandates and Group policies stipulate that traders must have a sound and prudent management of positions and must respect the defined frameworks. The allowed transactions, as well as risk hedging strategies, are also described in the desks mandates. The limits set for each activity are monitored daily by the Market Risk Department. This continuous monitoring of the market risk profile is the object of regular discussions between the risk and business teams, further to which various risk hedging or mitigation initiatives may be taken by the front office in order to remain within the defined limits. In the event of a breach of the risk framework, and in compliance with the limits follow-up procedure, the front office must detail the reasons, and take the necessary measures to return within the defined framework, or otherwise request a temporary or permanent increase of limit if the clients requests and if market conditions justify such a course of action.
In addition to the governance structure in place between the various departments of the Risk function and business lines, the monitoring of limits usage, due to the products/solutions provided to clients and the market-making activities, also contributes to ensuring that market risk to which the Group is exposed are properly managed and understood.
-
9.3 MARKET RISK MAIN MEASURES
Societe Generale monitors its exposure using stress test simulations to take into account exceptional market disruptions.
A stress test estimates the loss resulting from an extreme change in market parameters over a period corresponding to the time required to unwind or hedge the positions affected.
■the Global Stress Test on market activities, which estimates the losses linked to market risks, market/counterparty cross-risk, and dislocation and carry risk on exotic activities, that could arise simultaneously in the event of a severe but plausible systemic crisis. This stress test is modeled on five scenarios;
■the Market Stress Test, which focuses solely on market risks, applying the same scenarios as the Global Stress Test and additional scenarios corresponding to different market conditions.
The various scenarios for those stress tests are reviewed by the Risk Division on a regular basis. These reviews are presented during dedicated biannual Committees, chaired by the Market Risk Department and attended by economists and representatives of Societe Generale’s trading activities. These Committees cover the following topics: changes in scenarios (introduction, removal, shock review), appropriate coverage of the risk factors by the scenarios, review of the approximations made in terms of calculation, correct documentation of the whole process. The delegation level needed to validate the changes in stress test methodology depends on the impact of the change in question.
The Global Stress Test on market activities limits and the Market Stress Test limits play a central role in the definition and the calibration of the Group’s appetite for market risk: these indicators cover all activities and the main market risk factors and associated risks associated with a severe market crisis, this allows both to limit the overall amount of risk and to take into account any diversification effects.
This framework is complemented by stress-testing frameworks on four risk factors on which the Group has significant exposures, in order to reduce the overall risk appetite: equities, interest rates, credit spread and emerging markets.
The Global Stress Test on market activities is the main risk indicator used on this scope. It covers all the risks on market activities that would occur simultaneously in case of a severe, but plausible, market crisis. The impact is measured over a short period of time with an expected occurrence of once per decade. The Global Stress Test uses five market scenarios and has three components, each of which are considered in each of the five scenarios in order to ensure consistency within the same scenario:
■dislocation and carry risks on exotic activities related to concentration effects and crowded trades;
■market/counterparty cross-risks arising in transactions with weak counterparties (hedge funds and proprietary trading groups).
The Global Stress Test corresponds to the least favorable results arising from the five scenarios and their respective components.
■the results of the Market Stress Test(1) restricted to scenarios that could cause dislocation effects on market positions and default by weak counterparties. These scenarios all simulate a sharp fall in the equity markets and a widening in credit spreads which could trigger dislocation effects. Following the last review of the scenarios at the end of 2020, it was decided to use for the calculation of the stress test three theoretical scenarios (generalised (i.e. financial crisis scenario), eurozone crisis, general decline in risk assets) and two historical scenarios focusing respectively on the period of early October 2008 and early March 2020;
■the impact of the stress test scenario on CVA (Credit Value Adjustment) and FVA (Funding Value Adjustment) reserves, as their variations affect trading results.
Additional market risks to those assessed in the Market Stress Test can occur in market situation in which one or more participants – generally structured products sellers – have concentrated or crowded trades. Dynamic risk hedging strategies can cause larger market dislocations than those calibrated in the Market Stress Test, and these dislocations can extend beyond the shock timeline used due to an imbalance between supply and demand.
Equity, credit, fixed income, currency and commodity trading activities are regularly reviewed to identify these areas of risk and to define a scenario that takes into account the specific features of each activity and position. Each scenario associated with an identified area of risk is added to the market risk component if – and only if – it is compatible with the market scenario in question.
Some counterparties may be significantly affected by a major crisis on the financial markets and their probability of default may increase. The third component of the Global Stress Test therefore aims to take into account this increased risk on certain types of weak counterparties (hedge funds and proprietary trading groups).
■the collateralised financing stress test: this stress test focuses on collateralised financing activities and more specifically on weak counterparties. It applies a dislocation shock to several asset classes with the assumption of extremely tight liquidity conditions. Collateral and counterparty default rates are stressed concomitantly, taking into account any consanguinity with the collateral posted;
(1)Measurement of the impact in the Net Banking Product in case of shocks on all risk factors (refer to description below).
■the adverse stress test on hedge funds and proprietary trading groups (PTG): this stress test applies three pairs of stress scenarios to all market transactions generating replacement regarding this type of counterparty. Each set of scenarios consists of a short-term scenario (scenario derived from the Market Stress Test) applied to positions with margin calls, and a long-term scenario (whose shocks are generally more severe) for positions without margin calls. Stressed current exposures are weighted by the probability of default of each counterparty and by the loss given default (LGD), then aggregated.
This metric focuses on market risk and estimates the loss resulting from shocks on the set of risk factors. This stress test is based on 11 scenarios(1) (four historical and seven hypothetical). The main principles are as follows:
■the scenario considered in the market stress test is the worst of the different scenarios defined;
■the shocks applied are calibrated on time horizons specific to each risk factor (the time horizon can range from five days for the most liquid risk factors to three months for the least liquid);
■risks are calculated every day for each of the Bank’s market activities (all products together), using each of the historical and hypothetical scenarios.
This method consists of an analysis of the major economic crises that have affected the financial markets: changes in the prices of financial assets (equities, interest rates, exchange rates, credit spreads, etc.) during each of these crises have been analysed in order to define scenarios for potential variations in these main risk factors which, when applied to the Bank’s trading positions, could generate significant losses. Accordingly, this approach makes it possible to determine the historical scenarios used for the calculation of the stress test. This set of scenarios is also the subject of regular reviews. In 2020, two new historical scenarios related to the Covid-19 crisis were integrated: a crisis scenario (marked by a decline in equity indices and an increase in credit spreads) as well as a rebound scenario (marked by an increase in equity indices and a decrease in credit spreads). Societe Generale is currently using four historical scenarios in the calculation of the stress test, which cover the periods from October to December 2008 and March 2020.
The hypothetical scenarios are defined with the Group’s economists and are designed to identify possible sequences of events that could lead to a major crisis in the financial markets (e.g. a major terrorist attack, political instability in the main oil-producing countries, etc.). The Group’s aim is to select extreme but plausible events which would have major repercussions on all international markets. Accordingly, Societe Generale has defined seven hypothetical scenarios.
The Internal VaR Model was introduced at the end of 1996 and has been approved by the French regulator within the scope of the regulatory capital requirements. This approval was renewed in 2020 at the Target Review of Internal Models (TRIM).
The Value-at-Risk (VaR) assesses the potential losses on positions over a defined time horizon and for a given confidence interval (99% for Societe Generale). The method used is the “historical simulation” method, which implicitly takes into account the correlation between the various markets, as well as general and specific risk. It is based on the following principles:
■storage in a database of the risk factors that are representative of Societe Generale’s positions (i.e. interest rates, share prices, exchange rates, commodity prices, volatility, credit spreads, etc.). Controls are regularly performed in order to check that all major risk factors for the trading portfolio of the Group are taken into account by the internal VaR model;
■definition of 260 scenarios corresponding to one-day variations in these market parameters over a rolling one-year period; these scenarios are updated daily with the inclusion of a new scenario and the removal of the oldest scenario. There are three coexisting methods for modeling scenarios (relative shocks, absolute shocks and hybrid shocks), the choice between these methods for a given risk factor is determined by its nature and its historical trend;
■revaluation of daily positions, on the basis of the 260 sets of adjusted market parameters: in most cases this calculation involves a full repricing. Nonetheless, for certain risk factors, a sensitivity-based approach may be used.
Main risk factors
Description
Interest rates
Risk resulting from changes in interest rates and their volatility on the value of a financial instrument sensitive to interest rates, such as bonds, interest rate swaps, etc.
Share prices
Risk resulting from variations in prices and volatility of shares and equity indices, in the level
of dividends, etc.Exchange rates
Risk resulting from the variation of exchange rates between currencies and of their volatility.
Commodity prices
Risk resulting from changes in prices and volatility of commodities and commodity indices.
Credit Spreads
Risk resulting from an improvement or a deterioration in the credit quality of an issuer on the value
of a financial instrument sensitive to this risk factor such as bonds, credit derivatives (credit default swaps for example).Within the framework described above, the one-day 99% VaR, calculated according to the 260 scenarios, corresponds to the weighted average(1) of the second and third largest losses computed, without applying any weighting to the scenarios.
The day-to-day follow-up of market risk is performed via the one-day VaR, which is calculated on a daily basis at various granularity levels. Regulatory capital requirements, however, oblige us to take into account a ten-day horizon, thus we also calculate a ten-day VaR, which is obtained by multiplying the one-day VaR aggregated at Group level by the square root of ten. This methodology complies with regulatory requirements and has been reviewed and validated by the regulator.
The VaR assessment is based on a model and a certain number of conventional assumptions, the main limitations of which are as follows:
■by definition, the use of a 99% confidence interval does not take into account losses arising beyond this point; VaR is therefore an indicator of the risk of loss under normal market conditions and does not take into account exceptionally significant fluctuations;
■VaR is computed using closing prices, meaning that intraday fluctuations are not taken into account;
■the use of a historical model is based on the assumption that past events are representative of future events and may not capture all potential events.
The Market Risk Department mitigates the limitations of the VaR model by performing stress tests and other additional measurements.
The same model is used for the VaR computation for almost all of Global Banking & Investor Solution’s activities (including those related to the most complex products) and the main market activities of Retail Banking and Private Banking. The few activities not covered by the VaR method, either for technical reasons or because the stakes are too low, are monitored using stress tests, and capital charges are calculated using the standard method or through alternative in-house methods. For example, the currency risk of positions in the banking book is not calculated with an internal model because this risk is not subject to a daily revaluation and therefore cannot be taken into account in a VaR calculation.
The relevance of the model is checked through continuous backtesting in order to verify whether the number of days for which the negative result exceeds the VaR complies with the 99% confidence interval. The results of the backtesting are audited by the Risk Department in charge of the validation of internal models, which, as second line of defence, also assesses the theoretical robustness (from a design and development standpoint), the correctness of the implementation and the adequacy of the model use. The independent review process ends with (i) review and approval Committees and (ii) an Audit Report detailing the scope of the review, the tests performed and their outcomes, the recommendations and the conclusion of the review. The model control mechanism gives rise to reporting to the appropriate authorities.
In compliance with regulations, backtesting compares the VaR to the (i) actual and (ii) hypothetical change in the portfolio’s value:
■in the first case (backtesting against “actual P&L”), the daily P&L(2) includes the change in book value, the impact of new transactions and of transactions modified during the day (including their sales margins) as well as provisions and parameter adjustments made for market risk;
■in the second case (backtesting against “hypothetical P&L”), the daily P&L(3) includes only the change in book value related to changes in market parameters and excludes all other factors.
TRADING VAR (ONE-DAY, 99%), DAILY ACTUAL P&L AND DAILY HYPOTHETICAL P&L OF THE TRADING PORTFOLIO (2021, IN EURM)
(In EURm)
31.12.2021
31.12.2020
VaR
(10 days, 99%)(1)
VaR
(1 day, 99%)(1)
VaR
(10 days, 99%)(1)
VaR
(1 day, 99%)(1)
Period start
75
24
93
29
Maximum value
98
31
188
60
Average value
49
15
103
33
Minimum value
18
6
35
11
Period end
25
8
67
21
(1)Over the scope for which capital requirements are assessed by internal model.
VaR was less risky in 2021 (EUR 15 million versus EUR 33 million in 2020 on average). In line with the end of 2020, the VaR in 2021 continued its gradual decline over the year, reaching historically low levels in the 4th quarter. The decline was visible across all asset classes, which are also at low levels.
The Internal Stressed VaR model (SVaR) was introduced at the end of 2011 and has been approved by the Regulator within the scope of the regulatory capital requirements on the same scope as the VaR. As with the VaR model, this approval was renewed in 2020 at the Target Review of Internal Models (TRIM).
The calculation method used for the 99% one-day SVaR is the same as as the one for the VaR. It consists in carrying out a historical simulation with one-day shocks and a 99% confidence interval. Contrary to VaR, which uses 260 scenarios for one-day fluctuations over a rolling one-year period, SVaR uses a fixed one-year historical window corresponding to a period of significant financial tension.
The method for determining the fixed historical stress window in effect in 2021, which has been approved by the regulator(1), is based on a review of the historic shocks on the risk factors representative of the Societe Generale portfolio (related to equity, fixed income, foreign exchange, credit and commodity risks): historical shocks are aggregated to determine the period of highest stress for the entire portfolio. Each risk factor is assigned a weighting to account for the weight of each risk factor within its asset class and the weight of the asset class in the Group’s VaR. The historical window used is reviewed annually. In 2021, this window was “September 2008-September 2009”.
The ten-day SVaR used for the computation of the regulatory capital is obtained, as for VaR, by multiplying the one-day SVaR by the square root of ten.
The continuous backtesting performed on VaR model cannot be replicated to the SVaR model as, by definition, it is not sensitive to the current market conditions. However, as the VaR and the SVaR models rely on the same approach, they have the same advantages and limitations.
The relevance of the SVaR is regularly monitored and reviewed by the Risk Department in charge of the validation of internal models, as second line of defence. The independent review process ends with (i) review and approval Committees and (ii) an Audit Report detailing the scope of the review, the tests performed and their outcomes, the recommendations and the conclusion of the review. The model control mechanism gives rise to recurrent reporting to the appropriate authorities.
SVaR decreased on average in 2021 (EUR 37 million versus EUR 50 million in 2020). Its evolution over the year was marked by three main stages:
■in the first two quarters of the year, the SVaR remained at a low level, following the end of 2020. The low variability comes mainly from exotic perimeters and equity volatility as well as interest rate activities;
■SVaR increased in Q3 to EUR 60 million. This increase comes mainly from interest rate perimeters, in particular CIM(2) Basis and exotic;
■SVaR then gradually declined to its average level. The decrease coming from interest rate perimeters, due to the exposure of interest rate smile, cross currency and sensitivity to OIS/BOR.
(In EURm)
31.12.2021
31.12.2020
Stressed VaR
(10 days, 99%)(1)
Stressed VaR
(1 day, 99%)(1)
Stressed VaR
(10 days, 99%)(1)
Stressed VaR
(1 day, 99%)(1)
Period start
135
43
105
33
Maximum value
191
60
343
109
Average value
117
37
158
50
Minimum value
72
23
73
23
Period end
108
34
131
41
(1)Over the scope for which capital requirements are assessed by internal model.
At end-2011, Societe Generale received approval from the Regulator to expand its internal market risk modeling system by including IRC (Incremental Risk Charge) and CRM (Comprehensive Risk Measure), for the same scope as for VaR. As with the VaR model, the approval of the IRC(3) model was renewed in 2020 at the Target Review of Internal Models (TRIM).
They estimate the capital charge on debt instruments that is related to rating migration and issuer default risks. These capital charges are incremental, meaning they are added to the charges calculated based on VaR and SVaR.
■IRC is applied to debt instruments, other than securitisations and the credit correlation portfolio. In particular, this includes bonds, CDS and related derivatives;
■CRM exclusively covers the correlation portfolio, i.e. CDO tranches and First-to-Default products (FtD), as well as their hedging using CDS and indices.
(1)A complementary method was submitted to the regulator for approval in Q2 2018: the purpose was to ensure the relevance of the period obtained following the method based on the weighting of historical shocks by computing an approached VaR on the same selection of risk factors representative of the portfolio. The ECB validated this new method at the end of 2021: thus, in 2022 it will be used to determine the new historical window.
Societe Generale estimates these capital charges using internal models(1). These models determine the loss that would be incurred following especially adverse scenarios in terms of rating changes or issuer defaults for the year that follows the calculation date, without ageing the positions. IRC and CRM are calculated with a confidence interval of 99.9%: they represent the highest risk of loss obtained after eliminating 0.1% of the most unfavorable scenarios simulated.
The internal IRC model simulates rating transitions (including default) for each issuer in the portfolio, over a one-year horizon(2). Issuers are classified into five categories: US-based companies, European companies, companies from other regions, financial institutions and sovereigns. The behaviours of the issuers in each category are correlated with each other through a systemic factor specific to each category. In addition, a correlation between these five systemic factors is integrated to the model. These correlations, along with the rating transition probabilities, are calibrated from historical data observed over the course of a full economic cycle. In case of change in an issuer’s rating, the decline or improvement in its financial health is modeled by a shock in its credit spread: negative if the rating improves and positive in the opposite case. The price variation associated with each IRC scenario is determined after revaluation of positions via a sensitivity approach, using the delta, the gamma as well as the level of loss in the event of default (Jump to Default), calculated with the market recovery rate for each position.
The CRM model simulates issuer’s rating transitions in the same way as the internal IRC model. In addition, the dissemination of the following risk factors is taken into account by the model:
■recovery rate excluding default (uncertainty about the value of this rate if the issuer has not defaulted);
■recovery rate in the event of default (uncertainty about the value of this rate in case of issuer default);
■First-to-Default valuation correlation (correlation of the times of default used for the valuation of the First-to-Default basket).
These dissemination models are calibrated from historical data, over a maximum period of ten years. The price variation associated with each CRM scenario is determined thanks to a full repricing of the positions. In addition, the capital charge computed with the CRM model cannot be less than a minimum of 8% of the capital charge determined with the standard method for securitisation positions.
The internal IRC and CRM models are subject to similar governance to that of other internal models meeting the Pillar 1 regulatory requirements. More specifically:
■an ongoing monitoring allows to follow the adequacy of IRC and CRM models and of their calibration. This monitoring is based at least on a yearly review of the modeling hypotheses. As these metrics are estimated via a 99.9% quantile over a one-year horizon, the low frequency of breaches means that a backtesting as the one performed on VaR model is not possible. In particular, this review includes:
-a check of the adequacy of the structure of the rating transition matrices used for IRC and CRM models,
-a check of the adequacy of the models for the dissemination of recovery rates, spread dissemination and dissemination of basic correlations used in the CRM calculation;
-the IRC calculation being based on the sensitivities of each instrument – delta, gamma – as well as on the level of loss in the event of default (Jump to Default) calculated with the market recovery rate, the accuracy of this approach is checked against a full repricing every six months,
■these metrics are compared to normative stress tests defined by the regulator. In particular, the EBA stress test and the risk appetite exercise are performed regularly on the IRC metric. These stress tests consist of applying unfavorable rating migrations to issuers, shocking credit spreads and shocking rating transition matrices. Other stress tests are also carried out on an ad hoc basis to justify the correlation hypotheses between issuers and those made on the rating transition matrix;
■a weekly analysis of these metrics is carried out by the production and certification team for market risk metrics;
■the methodology and its implementation have been initially validated by the French Prudential and Resolution Supervisory Authority (Autorité de contrôle prudentiel et de résolution – ACPR). Thereafter, a review of the IRC and the CRM is regularly carried out by the Risk Department in charge of the validation of internal models as second line of defence. This independent review process ends with (i) review and approval Committees and (ii) an Audit Report detailing the scope of the review, the tests performed and their outcomes, the recommendations and the conclusion of the review. The model control mechanism gives rise to recurrent reporting to the appropriate authorities.
Moreover, regular operational checks are performed on the completeness of the scope’s coverage as well as the quality of the data describing the positions.
(1)The same internal model is used for all portfolios for which an IRC calculation is required. The same is true for the portfolios on which a CRM calculation is performed. Note that the scope covered with internal models (IRC and CRM) is included in the VaR scope: only entities authorised for a VaR calculation via an internal model can use an internal model for IRC and CRM calculation.
(2)The use of a constant one-year liquidity horizon means that shocks that are applied to the positions to calculate IRC and CRM, are instantaneous one-year shocks. This hypothesis appears to be the most prudent choice in terms of models and capital, rather than shorter liquidity horizons.
-
9.4 RISK-WEIGHTED ASSETS AND CAPITAL REQUIREMENTS
The on- and off-balance sheet items must be allocated to one of the two portfolios defined by prudential regulations: the banking book or the trading book.
The banking book is defined by elimination: all on- and off-balance sheet items not included in the trading book are included by default in the banking book.
The trading book consists of all positions in financial instruments and commodities held by an institution either for trading purposes or in order to hedge other positions in the trading book. The trading interest is documented as part of the traders’ mandates.
■the Finance Division’s prudential regulation experts are responsible for translating the regulations into procedures, together with the Risk Division for procedures related to holding period and liquidity. They also analyse specific cases and exceptions. They share these procedures to the business lines;
■the business lines comply with these procedures. In particular, they document the trading interest of the positions taken by traders;
The following controls are implemented in order to ensure that activities are managed in accordance with their prudential classification:
■new product process: any new product or activity is subject to an approval process that covers its prudential classification and regulatory capital treatment for transactions subject to validation;
■holding period: the Market Risk Department has designed a control framework for the holding period of certain instruments;
■liquidity: on a case-by-case basis or on demand, the Market Risk Department performs liquidity controls based on certain criteria (negotiability/transferability, bid/ask size, market volumes, etc.);
■strict process for any change in prudential classification, involving the business line and the Finance and Risk Divisions;
■internal audit: through its various periodic assignments, Internal Audit verifies or questions the consistency of the prudential classification with policies/procedures as well as the suitability of the prudential treatment in light of existing regulations.
Almost 90% of Societe Generale capital requirements related to market risk are determined using an internal model approach. The standard approach is mainly used for the Collective Investment Units (CIU), for securitisation positions, but also for the positions presenting a foreign exchange risk, which are not part of the trading book, as well as for the Group’s subsidiaries that do not have access to the core IT tools developed internally. The main entities concerned are some International Retail Banking and Financial Services entities such as SG Maroc, Rosbank, BRD, SG Tunisie, SG Algérie, etc.
Capital requirements for market risk decreased in 2021. This decline is reflected in most components:
■VaR continued its year-over-year decline, which began at the end of 2020, reaching historically low levels in Q4. This decline is reflected in all activities, including interest rates, credit and equity;
■IRC and CRM, whose decrease is mainly due to the reduction in debt instruments positions by the front office;
■RWAs calculated under the standard approach, which have mainly benefited from a reduction in interest rate risk especially to the reduced exposure of several subsidiaries.
The increase in capital requirements for risk assessed for ownership positions can be explained by both the front office activity (positions in options) and methodological changes.
Risk-weighted assets
Capital requirement
(In EURm)
31.12.2021
31.12.2020
Change
31.12.2021
31.12.2020
Change
VaR
1,343
4,117
(2,773)
107
329
(222)
Stressed VaR
7,227
6,671
555
578
534
44
Incremental Risk Charge (IRC)
840
1,758
(918)
67
141
(73)
Correlation portfolio (CRM)
815
1,066
(251)
65
85
(20)
Total market risk assessed by internal model
10,225
13,612
(3,387)
818
1,089
(271)
Specific risk related to securitisation positions in the trading portfolio
562
534
28
45
43
2
Risk assessed for currency positions
-
219
(219)
-
17
(17)
Risks assessed for interest rates (excl. securitisation)
285
975
(691)
23
78
(55)
Risk assessed for ownership positions
572
-
572
46
-
46
Risk assessed for commodities
0
0
(0)
0
0
(0)
Total market risk assessed by standard approach
1,419
1,728
(309)
114
138
(25)
TOTAL
11,643
15,340
(3,697)
931
1,227
(296)
Risk-weighted assets
Capital requirement
(In EURm)
31.12.2021
31.12.2020
31.12.2021
31.12.2020
Risk assessed for currency positions
349
462
28
37
Risk assessed for credit (excl. deductions)
3,984
5,943
319
475
Risk assessed for commodities
39
43
3
3
Risk assessed for ownership positions
4,474
4,133
358
331
Risk assessed for interest rates
2,797
4,760
224
381
TOTAL
11,643
15,340
931
1,227
-
9.5 FINANCIAL INSTRUMENTS VALUATION
Management risk related to financial instrument valuation relies on the Global Market Division as first line of defence, by the team of valuation experts (Group Valuation) within the Finance Division, and finally by the team of independent review of valuation models within the Market Risk Department.
Governance on valuation topics is enforced through two valuation Committees, both attended by representatives of the Global Markets Division, the Market Risk Department and the Finance Division:
■the Global Valuation Committee is convened whenever necessary, and at least every quarter, to discuss and approve financial instrument valuation methodologies (model refinements, reserve methodologies, etc.). This Committee, chaired by the Finance Division and organised by its valuation expert team (Valuation Group) has global accountability with respect to the approval of the valuation policies;
■on a quarterly basis, the Global Valuation Review Committee, chaired by the Finance Division, reviews changes in reserves, valuation adjustment figures, and related accounting impacts. This analytical review is performed by the Valuation Group.
The topics related to Prudent Valuation are dealt with during methodological Committees and validation Committees, organised quarterly, and both chaired by the Finance Division and both attended by representatives of the Global Markets Division and the Market Risk Department.
Lastly, a Valuation Policy describes the valuation framework and its governance, specifying the breakdown of responsibilities between the stakeholders.
In terms of valuation, market products are marked to market, when such market prices exist; otherwise, they are valued using parameter-based models, in compliance with the IFRS 13 principles defining fair value.
On the one hand, each model designed by the front office is subject to independent validation by the Market Risks Department as second line of defence that especially checks the theoretical aspects of the model (relevance of the hypotheses, analytical calculations, numerical methods), its performance (for instance in case of stressed conditions) and its implementation in systems. Following this review, the validation status of the model, its scope of use and the recommendations to be dealt with are formalised in a report.
On the other hand, the parameters used in the valuation models – whether or not they come from observable data – are subject to controls by the Market Risks Department and the Finance Division (Independent Price Verification).
If necessary, the valuations are supplemented by reserves or adjustments (this mainly concerns liquidity, parameter or model uncertainties) using calculation methods developed in consultation with the front office, which are subject to approval by the Market Risk Department and the Finance Division during the Global Valuation Committees.
Furthermore, regarding the prudential component, Additional Valuation Adjustments (AVAs) are computed on fair value assets, in compliance with the Regulatory Technical Standards (RTS) published by the European Banking Authority (EBA), which lay out the requirements related to Prudent Valuation, in addition to the principles already specified in the CRD (Capital Requirements Directive). These Regulatory Technical Standards define the various uncertainties which have to be taken into account in the Prudent Valuation and set a target level of confidence to reach.
Within this framework, in order to take into account the various factors which could generate additional exit costs compared to the expected valuation (model risk, concentration risk, liquidation cost, uncertainty on market prices, etc.), Prudent Valuation Adjustments (PVAs) are computed for each exposure. The Additional Valuation Adjustments (AVAs) are defined as the difference between the Prudent Valuation obtained and the accounting fair value of the positions, in order to comply with the target level of confidence to reach (the confidence interval is equal to 90%). These amounts of AVA are deducted from the Common Equity Tier 1 capital.
-
9.6 ADDITIONAL QUANTITATIVE INFORMATION ON MARKET RISK
Risk-weighted assets
(In EURm)
31.12.2021
31.12.2020
Outright products
Interest rate risk (general and specific)
731
975
Equity risk (general and specific)
122
-
Foreign exchange risk
-
219
Commodity risk
0
0
Options
Simplified approach
-
-
Delta-plus method
5
-
Scenario approach
-
-
Securitisation (specific risk)
562
534
TOTAL
1,419
1,728
Outright products refer to positions in products that are not optional.
Risk-weighted assets
Capital requirements
(In EURm)
31.12.2021
31.12.2020
31.12.2021
31.12.2020
1
VaR (higher of values a and b)
1,343
4,117
107
329
(a)
Previous day’s VaR (Article 365(1) (VaRt-1))
23
79
(b)
Average of the daily VaR (Article 365(1)) on each of the preceding sixty business days (VaRavg) x multiplication factor ((mc) in accordance with Article 366)
107
329
2
SVaR (higher of values a and b)
7,227
6,671
578
534
(a)
Latest SVaR (Article 365(2) (SVaRt-1))
227
252
(b)
Average of the SVaR (Article 365(2) during the preceding sixty business days (SVaRavg) x multiplication factor (ms) (Article 366)
578
534
3
Incremental risk charge – IRC (higher of values a and b)
840
1,758
67
141
(a)
Most recent IRC value (incremental default and migration risks section 3 calculated in accordance with Section 3 articles 370/371)
67
112
(b)
Average of the IRC number over the preceding 12 weeks
66
141
4
Comprehensive Risk Measure – CRM (higher of values a, b and c)
815
1,066
65
85
(a)
Most recent risk number for the correlation trading portfolio (article 377)
40
70
(b)
Average of the risk number for the correlation trading portfolio over the preceding 12-weeks
65
85
(c)
8% of the own funds requirement in SA on most recent risk number for the correlation trading portfolio (Article 338(4))
57
75
5
Other
-
-
-
-
6
TOTAL
10,225
13,612
818
1,089
(In EURm)
31.12.2021
31.12.2020
VaR (10 days, 99%)(1)
Maximum value
98
188
Average value
49
103
Minimum value
18
35
Period end
25
67
Stressed VaR (10 days, 99%)(1)
Maximum value
191
343
Average value
117
158
Minimum value
72
73
Period end
108
131
Incremental Risk Charge (99.9%)
Maximum value
205
172
Average value
116
103
Minimum value
51
53
Period end
67
112
Comprehensive Risk capital charge (99.9%)
Maximum value
102
462
Average value
64
116
Minimum value
40
51
Period end
57
70
(1)On the perimeter for which the capital requirements are assessed by internal model.
(In EURm)
VaR
SVaR
IRC
CRM
Other
Total
RWA
Total own funds
requirements
RWA at end of previous reporting period (30.09.2021)
2,248
7,677
1,790
800
-
12,515
1,001
Regulatory adjustment
(1,569)
(3,934)
(319)
(30)
-
(5,852)
(468)
RWA at the previous quarter-end (end of the day)
680
3,742
1,471
770
-
6,663
533
Movement in risk levels
(306)
187
(631)
(267)
-
(1,017)
(81)
Model updates/changes
(84)
(1,084)
-
-
-
(1,168)
(93)
Methodology and policy
-
-
-
-
-
-
-
Acquisitions and disposals
-
-
-
-
-
-
-
Foreign exchange movements
(1)
(4)
-
-
-
(5)
(0)
Other
-
-
-
-
-
-
-
RWA at the end of the disclosure period (end of the day)
289
2,841
840
503
-
4,473
358
Regulatory adjustment
1,054
4,385
-
312
-
5,751
460
RWA at end of reporting period (31.12.2021)
1,343
7,227
840
815
-
10,225
818
■regulatory adjustment: difference between RWA used for the purpose of regulatory RWA calculation on the one hand and RWA of the last day or of the last week of the period on the other hand;
■model updates/changes: significant updates to the model to reflect recent experience (e.g. recalibration), as well as significant changes in model scope;
■methodology and policy: methodology changes to the calculations driven by regulatory policy changes;
-
10 OPERATIONAL RISK
Operational risk is defined as the risk of loss resulting from inadequate or failed internal processes, people and systems or from external events.
Operational risk RWA at end 2021
EUR 46.8bn
(Amount at end 2020: EUR 49.2bn)
Share of RWA calculated via the advanced approach at end 2021
95%
Operational risk is the risk of losses resulting from inadequacies or failures in processes, personnel or information systems, or from external events.
Societe Generale’s operational risk classification is divided into eight event categories:
■commercial litigation;
■disputes with authorities;
■errors in pricing or risk evaluation including model risk;
■execution errors;
■fraud and other criminal activities;
■rogue trading;
■loss of operating resources;
■IT system interruptions.
This classification is declined into 58 risk categories, cornerstone o fthe Group risk modeling, ensuring consistency throughout the system and enabling cross-business analyses throughout the Group(see section 10.2), particularly on the following risks :
■risks related to information and communication technologies and security (cybercrime, IT systems failures, etc.);
■risks related to outsourcing of services and business continuity;
■risks related to the launch of new products/services/activities for customers;
■non-compliance risk (including legal and tax risks): risk of court-ordered, administrative or disciplinary sanctions, or of material financial loss, due to failure to comply with the provisions governing the Group’s activities;
■reputational risk: risk arising from a negative perception on the part of customers, counterparties, shareholders, investors or regulators that could negatively impact the Group’s ability to maintain or engage in business relationships and to sustain access to sources of financing;
■misconduct risk: risk resulting from actions (or inactions) or behavior of the Bank or its employees inconsistent with the Group’s Code of Conduct, which may lead to adverse consequences for our stakeholders, or place the Bank’s sustainability or reputation at risk.
The framework relating to the risks of non-compliance, reputation and inappropriate conduct is detailed in Chapter 13 “Compliance risk, litigation”.
-
10.1 ORGANISATION OF OPERATIONAL RISK MANAGEMENT
The Group operational risk management framework, other than non-compliance risks detailed in Chapter 13 “Compliance risk, litigation” is structured around a two-level system with the following participants:
■a first line of defence in each core Business Units/Service Units, responsible for applying the framework and putting in place controls that ensure risks are identified, analysed, measured, monitored, managed, reported and contained with the limits set by the Group-defined risk appetite;
■conducts a critical examination of the BU/SUs management of operational risks (including fraud risk, risks related to information systems and information security, and risks related to business continuity and crisis management);
■sets regulations and procedures for operational risk systems and production of cross Group analyses;
To cover the whole Group, the Operational Risk Department has a central team supported by regional hubs. The regional hubs report back to the department, providing all information necessary for a consolidated overview of the Bank’s risk profile that is holistic, prospective and valid for both internal oversight purposes and regulatory reporting.
The regional hubs are responsible for implementing the Operational Risk Division’s briefs in accordance with the demands of their local regulators.
The Operational Risk Department communicates with the first line of defence through a network of operational risk correspondents in each Business /Service Units.
Concerning risks specifically linked to business continuity, crisis management and information, of persons and property, the Operational Risk Department carries out the critical review of the management of these risks in connection with the Group Security Division. Specifically, regarding IT risks, the Operational Risk Department carries out the critical review of the management of these risks in connection with the Resources and Digital Transformation Department.
Level 2 control consists of verifying the definition and actual performance of level 1 controls, and in particular the examination of the results of level 1 controls in quantitative and qualitative aspects, in particular with regard to completion rate, anomaly levels, etc. This review also ensures the effectiveness and relevance of the deployment of controls by control needs and risk type and of corrective action plans.
According to the internal control system, the level 2 permanent control Risk teams carry out this mission on the risks operational covering the risks specific to the various businesses (including operational risks related to credit risks and market risks), as well as the risks associated with purchases, communication, real estate, human resources and information system.
Protecting persons and property, and compliance with the laws and regulations governing security are major objectives for Societe Generale group. It is the mission of the Group Security Division to manage human, organizational and technical frameworks that guarantee the smooth operational functioning of the Group in France and internationally, by reducing exposure to threats (in terms of security and safety) and reducing their impact in the event of crisis.
■security is all the human, organizational and technical resources brought together to deal with technical, physical, chemical and environmental accidents that can harm people and property;
■safety is all the human, organizational and technical resources brought together to deal with spontaneous or thoughtful acts aimed at harming or impairing with the aim of psychic or / and financial profit.
The management of all these risks is based on operational risk systems and the second line of defence is provided by the Risk Department.
Given the importance for the Group of its information system and the data it conveys and the continuous increase in the cybercriminal threat, the risks related to information and communication technologies and to security (ICT) are major for Société Generale. Their supervision, integrated into the general operational risk management system, is steered as the first line of defence by a dedicated area of expertise (Information and Information Systems Security – ISS) and the second line of defence is provided by the Risk Department. They are subject to specific monitoring by the management bodies through sessions dedicated to Group governance (Risk Committee, CORISQ, CCCIG, DTCO) and a quarterly dashboard which presents the risk situation and action plans on the eight main themes of information and communication technologies risks.
The Department Security of the Group, housed within the General Secretariat, is responsible for protecting information. The information provided by customers, employees and also the collective knowledge and know-how of the bank constitute Societe Generale’s most valuable information resources. To this end, it is necessary to put in place the human, organizational and technical mechanisms which make it possible to protect the information and ensure that it is handled, disseminated, shared by only the people who need to know. To this end, the Group safety/security department ensures in particular:
■the publication and maintenance of the Group information security policy which encompasses both human and technical aspects;
■the publication and maintenance, with the teams of legal experts and the Group’s human resources functions, of the “Charter for the Protection of Information and IT Resources”;
■the co-construction with the Service Unit Resources & Digital Transformation of the Data-Protection program, which aims to provide employees with a tool for classifying and protecting office documents, to promote good practices in the classification of information and in the use of property tools adapted to the sensitivity of documents;
■the awareness raising of information security through a set of permanent actions promoting employee ownership of information security issues: distribution of an e-learning on information security to all of the Group’s employees in France and abroad, conferences, specific workshops on the risks associated with social engineering, on the use of social networks, etc.
The person in charge of risks related to information and communication technologies (ICT) and security of information systems is housed at the Corporate Resources and Digital Transformation Division. Under the functional authority of the Director of Group Security, he recommends the strategy to protect digital information and heads up the IT security department. The IT security framework is aligned with the market standards (NIST, ISO 27002), and implemented in each Business/Service Unit.
Risk management associated with cybercrime is carried out through the tri-annual Information Systems Security (ISS) master plan.
In order to take into account the evolution of the threat, in particular that related to ransomware, and in line with the Group strategy, the ISS 2021-2023 master plan is structured, with a budget of 650 million euros over the period 2021-2023, around two pillars that guide actions by 2023:
■protect the data of our customers and our ability to operate the banking services, by integrating the threats, the requirements of the regulators, and the need to support the Business Units and Service Units in their digital transformation and the evolution of uses that accompanies it. A risk-based approach allows us to concentrate our efforts on the most critical elements and data, in connection with the work of the Security Department cited above. We are preparing to manage a major cyber crisis by improving in particular our detection capacity, our ability to control our IT links with our partners and subsidiaries, and our ability to rebuild the information system;
■increase our operational efficiency by gaining overall consistency, and by increasing our protections and our ability to react. In particular by developing the management of the cyber security department, by optimising our processes and our tools to be able to deploy new protections at constant cost. Finally, by working on the management of human resources in the filiere, in particular on the development of skills and networks of expertise.
At the operational level, the Group relies on a CERT (Computer Emergency Response Team) unit in charge of incident management, security watch and the fight against cybercrime. This team uses multiple sources of information and monitoring, both internal and external. Since 2018, this unit has also been strengthened by the establishment of an internal Red Team whose main tasks are to assess the effectiveness of the security systems deployed and to test the detection and reaction capabilities of the defence teams (Blue Teams) during an exercise simulating a real attack. The services of the Red Team enable the Group to gain a better understanding of the weaknesses in the security of the Societe Generale information system, to help in the implementation of global improvement strategies, and also to train cybersecurity defence teams. CERT works closely with the Security Operation Center (SOC), which is in charge of detecting security events and processing them.
A team at the Resources and Digital Transformation Department is in charge of the consistency of the implementation of operational risk management systems and their consolidation for IT processes. The main tasks of the team are as follows:
■identify and evaluate the major IT risks for the Group, including extreme risk scenarios (eg. cyberattack, failure of a provider), to enable the Bank to improve its knowledge of its risks, be better prepared for extreme risk scenarios and better align their investments with their IT risks;
■produce the indicators that feed the IT risks monitoring dashboard, intended for management bodies and Information Systems directors. They are reviewed regularly with the second line of defence in order to remain aligned with the IS and SSI strategy and their objectives;
■more generally, ensure the quality and reliability of all devices addressing IT operational risks. Particular attention is paid to the permanent control system for its IT risks, which is based on the definition of normative IT and security controls and the support of the Group in the deployment of managerial supervision on this topic. As part of the “PCT” program to transform permanent control, the normative controls were reviewed, i.e. around thirty controls on IS/SSI subjects. The IT Department monitors the deployment of these controls across the Group, the progress of which is aligned with the objectives set by the Group.
In terms of awareness, a multilingual online training module on information security is mandatory for all internal Group staff and for all service providers who use or access our information system. It was updated in early 2020 in order to incorporate changes to the new Group Information Security Policy. At the end of August 2021, 98% of Societe Generale group employees who were notified of the training module had performed it.
The supervision of fraud risk, whether internal or external, is integrated into the general operational risk management framework which allows the identification, assessment, mitigation and monitoring of the risk, whether it is potential or actual.
It is steered in the first line of defense by dedicated expert teams dedicated to fraud risks management in addition to the teams in charge of operational risk management specific to each of the banking businesses. These teams are in charge of the definition and operational implementation of the means of raising awareness, preventing, detecting and dealing with frauds. The second line of defense is provided by the Operational Risks Department with a fraud risk manager. The second line defines and verifies compliance with the principles of fraud risk management in conjunction with the first line teams, and ensures that the appropriate governance is in place.
Finally, the teams, whether they are in the first or second line of defense, work jointly with teams of experts in charge of information security, the fight against cyber crime, customer knowledge, the fight against corruption and money laundering. Likewise, the teams work closely with the teams in charge of credit risk and market risk. The sharing of information contributes to the identification and increased responsiveness in the presence of a situation of proven fraud or weak signals. This active collaboration makes it possible to initiate investigative measures, blocking attempted fraud or initiating the recovery of funds or the activation of guarantees, associated insurance in the event of successful fraud.
-
10.2 OPERATIONAL RISK MONITORING PROCESS
Internal losses have been compiled throughout the Group since 2003, in addition to significant incident data since 2019. The process:
Losses (or gains or near-misses) are reported from a minimum threshold of EUR 10,000 throughout the Group, except for global market activities, where the threshold is EUR 20,000.
Incidents without financial impact are also reported when they are deemed significant according to their impact, in particular on contractual commitments, reputation, day-to-day operations, risk appetite or the level of regulatory compliance of the Group.
External losses are data that are public and/or shared within the banking sector, in particular within consortia frameworks.
These external data include information on the amount of actual losses, the importance of the activity at the origin of these losses, the causes and circumstances and any additional information that could be used by other establishments to assess the relevance of the event as far as they are concerned and enrich the identification and assessment of the Group’s operational risk.
Under the Risk and Control Self-Assessment (RCSA), each manager assesses the exposure to operational risks to which each entity within the relevant scope is exposed through the activities in order to improve their management.
The method defined by the Group consists of taking a homogeneous approach to identifying and evaluating operational risks and frameworks to control these risks, in order to guarantee consistency of results at Group level. It is based notably on repositories of activities and risks in order to facilitate a comprehensive assessment.
■identifying and assessing the major operational risks (in average amount and frequency of potential loss) to which each activity is exposed (the intrinsic risks, i.e. those inherent in the nature of an activity, while disregarding prevention and control systems). Where necessary, risk mapping established by the functions (e.g. Compliance, Information Systems Security, etc.) contributes to this assessment of intrinsic risks;
■assessing the risk exposure of each activity that remains once the risk prevention and mitigation measures are taken into account (the “residual risk”), while disregarding insurance coverage;
■remedying any shortcomings in the prevention and control systems, by implementing corrective action plans and defining key risk indicators; if necessary, in the absence of an action plan, risk acceptance will be formally validated by the appropriate hierarchical level;
On an ongoing basis, the risk assessment also feeds on the results of other operational risk management frameworks in order to ensure a relevant and consistent assessment. The assessment methods for certain risks are increasingly based on in-depth approaches adapted to the type of underlying risk while incorporating the results on assessment scales and shared benchmarks allowing the comparison and prioritization of areas of risks or scope of activities.
Key risk indicators (KRIs) supplement the overall operational risk management system by providing a dynamic view (warning system) of changes in business risk profiles.
Their follow-up provides managers of entities with a regular measure of improvements or deteriorations in the risk and the environment of prevention and control.
A cross analysis of Group-level KRIs and losses is presented to the Group’s Executive Committee on a quarterly basis via a specific dashboard.
The analyses of scenarios serve two purposes: informing the Group of potential significant areas of risk and contributing to the calculation of the capital required to cover operational risks.
These analyses make it possible to build an expert opinion on a distribution of losses for each risk category and thus to measure the exposure to potential losses in scenarios of very severe severity, which can be included in the calculation of the prudential capital requirements.
In practice, various scenarios are reviewed by experts who gauge the severity and frequency of the potential impacts for the Group by factoring in internal and external loss data as well as the internal framework (controls and prevention systems) and the external environment (regulatory, business, etc.). Analyzes are carried out either at Group level (transversal scenarios) or at business level.
■allow the approval of the scenarios by the businesses (for example during the internal control coordination committees of the departments concerned or during ad hoc meetings) and a challenge of scenario analyses by LOD2;
■conduct an overall review of the Group’s risk hierarchy and of the suitability of the scenarios through CORISQ.
The Committee, jointly coordinated by the Risk Division and the relevant businesses, is a decision-making body which decides the production and marketing conditions of new products to customers.
The Committee aims to ensure that, before any product launch, all types of induced risks (credit, market, liquidity and refinancing, country, operational, legal, accounting, tax, financial, information systems risks as well as the risks of non-compliance, reputation, protection of personal data and corporate social and environmental responsibility risks, etc.) have been identified, assessed and, if necessary, subjected to mitigation measures allowing the acceptance of residual risks.
The definition of “new product” extends from the creation of a new product or service to the development of an existing product or service as soon as this development is likely to generate different or higher risks. The development may be linked to matters such as a new regulatory environment, to marketing on a new scope or to a new type of clientele.
Some banking services are outsourced outside the Group or within the Group (e.g. in our shared service centers). These two subcontracting channels are supervised in a manner adapted to the risks.
A framework with standards and a tool helps ensure that the operational risk linked to outsourcing is controlled, and that the conditions set by the Group’s approval are respected.
It helps to map the Group’s outsourcing with an identification of the activities and BU/SU concerned, and to put outsourcing under control with knowledge of risks and with suitable supervision.
During the study phase, the business/service units decide on the outsourcing of services within the framework of standards set by the Group. Outsourcing projects are led by a project manager and validated by the sponsor who accepts the residual risk level after a risk analysis based on expert opinions. This ensures the consistency of the assessments and the consistency of decisions across the Group.
The analysis includes operational risks (including fraud, execution risk, etc.), tax, non-compliance, supplier, business continuity risks, risks related to data quality, and risks related to information security and data protection.
Legal experts use the same definition of essential outsourcing of services as that defined in the Decree of 3 November 2014.
Services at Group level are subject to reinforced monitoring through very regular contractual monitoring. These services are identified using criteria such as the concept of “core business activity”, financial impact and reputation risk. These services are validated by a dedicated Committee, chaired by the Operational Risk Department.
The reinforcement of the system will continue in 2022, in particular with the addition of clarifications on the methodological framework, a greater involvement of senior management in the supervision of this risk and the intensification of the role of the 2nd line of defense in the management, review and control of outsourced services.
Business continuity is managed by developing in each Societe Generale group entity, organisations, procedures and resources that can deal with natural or accidental damage, or acts of deliberate harm, with a view to protect their personnel, assets and activities and to allow the provision of essential services to continue, if necessary temporarily in reduced form, then restoring service to normal.
The aim is not only to meet regulatory obligations but also to minimise as far as possible any harm to personnel, clients or infrastructure and so preserve intact the Group’s image, goodwill, brands, products, procedures and know-how and limit the impact of events on the Group’s financial position and solvency.
Based on the identification of threats to the Group and their possible effects and, making due allowance for preventative, protective and dissuasive measures, management of business continuity consists of:
■being able to respond efficiently to these scenarios of crisis, loss or unavailability of human or operational resources;
■maintaining these frameworks to ensure they remain efficient (reviewing the appropriateness of scenarios, allowing for changes to the organisation, adjustments to resources, functional tests).
-
10.3 OPERATIONAL RISK MEASUREMENT
Since 2004, Societe Generale has used the Advanced Measurement Approach (AMA) allowed by the Capital Requirements Directive to measure operational risk. This approach, implemented across the main Group entities, notably makes it possible to:
■identify the types of risk that have the greatest impact on the Group’s risk profile and overall capital requirements;
The statistical method used by the Group for operational risk modeling is based on the Loss Distribution Approach (LDA) for AMA internal model.
Under this approach, operational risks are modeled using segments, each segment representing a type of risk and a Group core business. The frequency and severity of operational risks, based on past internal losses, external losses, the internal and external environment, and scenario analyses, are estimated and the distribution of annual losses is calculated for each segment. This approach is supplemented by cross-business scenario analyses that measure cross-business risks for core businesses, such as cybercriminality and the flooding of the river Seine.
Aside from the individual risks associated with each segment or cross-business scenario analysis, the model takes into account the diversification between the various types of risk and the core businesses, dependency effects between extreme risks as well as the effect of insurance policies taken out by the Group.
The Group’s regulatory capital requirements for operational risks within the scope covered by the (AMA) internal model are then defined as the 99.9% quantile of the Group’s annual loss distribution.
For some Group entities, notably in retail banking activities abroad, the standard method is applied: the calculation of capital requirements is defined as the average over the last three years of a financial aggregate based on the Product Net Banking multiplied by factors defined by the regulator and corresponding to each category of activity. To make the calculation, all of the Group’s business lines are broken down into the eight regulatory activities.
Societe Generale’s total capital requirements for operational risks were EUR 3.7 billion at the end of 2021, representing EUR 47 billion in risk-weighted assets. This assessment includes the capital requirement of AMA and Standard perimeters.
In accordance with regulations, Societe Generale incorporates risk cover provided by insurance policies when calculating regulatory capital requirements for operational risks, within the limit of 20% of said requirements. These insurance policies cover part of the Group’s major risks, i.e. civil liability, fraud, fire and theft, as well as systems interruptions.
Risk reduction through insurance policies resulted in a 6.5% decrease in total capital requirements for operational risks.
Over the past five years, Societe Generale’s operational risks were concentrated on average on five types, accounting for 93% of the Group’s total operating losses:
■fraud and other criminal activities represented 32% of the amount of operating losses over the period. They are mainly composed of external frauds on financing files (falsified financial statements by the client, theft or misappropriation of collateral/guarantees, etc.), fraud on manual means of payment (cash, transfer and cheque) and supplier fraud on financed equipment; the trend is downward in 2021 due in particular to a lower loss experience in external fraud on financing files;
■execution errors represented 20% of total operational losses, thereby constituting the second leading cause of loss for the Group. After two consecutive years of increase (including the Covid effect in 2020), the amount of losses in this category is falling back to values close to the average; the proper execution of the remediation plans explains the decline observed in 2021;
■litigation with authorities, the third largest category, represented 17% of the Group’s operational losses over the period; the 2021 provisions relate to files born before 2016;
■pricing or risk assessment errors, including model risk, represent 13% of the total amount of losses. The main cases concern the pricing and ALM models;
■commercial disputes represented 11% of total Group operating losses. The trend is down for this category over the period considered; the 2021 provisions mainly relate to files born before 2015.
-
10.4 RISK-WEIGHTED ASSETS AND CAPITAL REQUIREMENTS
Societe Generale’s capital requirements for operational risk are mainly calculated using the Advanced Measurement Approach (AMA) via its internal model (95% in 2021).
The amount of RWA on the AMA scope decreased in 2021 (EUR -2.5 billion, i.e. -5.4%). This decrease is linked to the update of scenarios analyses, which may evolve downward for some categories of operational risk events.
The following table breaks down the Group’s risk-weighted assets and the corresponding capital requirements as at 31 December 2021.
31.12.2021
(In EURm)
Relevant indicator
Own funds
requirements
Risk-weighted
assets
Banking activities
31.12.2019
31.12.2020
31.12.2021
Banking activities subject to basic indicator approach (BIA)
-
-
-
-
-
Banking activities subject to standardised (TSA)/ alternative standardised (ASA) approaches
1,365
1,437
1,481
193
2,412
Subject to TSA
1,365
1,437
1,481
Subject to ASA
-
-
-
Banking activities subject to advanced measurement approaches AMA
23,643
21,964
23,980
3,552
44,394
(In EURm)
31.12.2020
Relevant indicator(1)
Own funds
requirements
Risk-weighted
assets
Banking activities
31.12.2018
31.12.2019
31.12.2020
Banking activities subject to basic indicator approach (BIA)
-
-
-
-
-
Banking activities subject to standardised (TSA)/ alternative standardised (ASA) approaches
1,170
1,365
1,437
180
2,250
Subject to TSA
1,170
1,365
1,437
Subject to ASA
-
-
-
Banking activities subject to advanced measurement approaches AMA
24,657
23,643
21,964
3,755
46,938
(1)Historical data including the updates, reflecting some evolutions in the scope of entities, which occurred across the year.
-
10.5 OPERATIONAL RISK INSURANCE
Since 1993, Societe Generale has implemented a global policy of hedging Group operational risks through insurance.
This consists in searching the market for the most extensive cover available for the risks incurred and enabling all entities to benefit from such cover wherever possible. Policies are taken out with leading insurers. Where required by local legislation, local policies are taken out, which are then reinsured by insurers that are part of the global program.
In addition, special insurance policies may be taken out by entities that perform specific activities.
A Group internal reinsurance company intervenes in several policies in order to pool high-frequency, low-level risks between entities. This approach contributes to the improvement of the Group’s knowledge and management of its risks.
Buildings and their contents, including IT equipment, are insured at their replacement value. The guarantee covering acts of terrorism abroad has been renewed.
Liability other than professional liability (i.e. relating to operations, Chief Executive Officers and Directors, etc.) are covered. The amounts insured vary from country to country, according to operating requirements.
Insurance is only one of the measures used to offset the consequences of the risks inherent in the Group’s activity. It complements the Group’s risk management policy.
These risks are included in the “Banker’s Blanket Bond” policy that insures all the Group’s financial activities around the world.
Internal fraud (committed by an employee or by a third party acting with the aid of an employee) and external fraud (committed by a third party acting alone), with the intent to obtain illicit personal gain or to harm the Group, are covered.
The consequences of any legal on staff or managers in the Group’s professional activities are insured under a global policy.
-
11 STRUCTURAL INTEREST RATE AND EXCHANGE RATE RISKS
Structural interest rate and exchange rate risks correspond to the risk of losses of interest margin or value of the fixed rate structural position arising from variations in interest or exchange rates. Structural interest rate and exchange rate risks arise from commercial activities and from transactions entered into by the Corporate Centre.
This section describes the monitoring of structural risks and provides information on structural interest rate and exchange rate risks.
Structural exposure to interest rate and exchange rate risks results from commercial transactions, their associated hedging transactions and corporate centre transactions.
The interest rate and exchange rate risks linked to Trading Book activities are excluded from the structural risk measurement scope as they belong to the category of market risks. Structural and market exposures constitute the Group’s total interest rate and exchange rate exposure.
The general principle is to reduce structural interest rate and exchange rate risks to the greatest possible extent within the consolidated entities. Within the entities, commercial and corporate centre operations must therefore be matched in terms of interest rates and exchange rates as much as possible. At the consolidated level, a structural foreign exchange position is maintained in order to minimise the sensitivity of the Group’s Common Equity Tier 1 (CET1) ratio to exchange rates fluctuations.
-
11.1 ORGANISATION OF THE MANAGEMENT OF STRUCTURAL INTEREST RATE AND EXCHANGE RATE RISKS
The principles and standards for managing these risks are defined at the Group level. The entities are first and foremost responsible for managing these risks. The ALM (Asset and Liability Management) Department within the Group’s Finance Division leads the control framework of the first line of defense. The ALM department of the Risk Department assumes the role of second line of defense supervision.
■validate and ensure the adequacy of the system for monitoring, managing and supervising structural risks;
The second-level supervision of the ALM models used within the Group and of associated frameworks is provided by a dedicated service within the Risk department, the Asset Liability Management Risk - Structural and Liquidity Risk department. Accordingly, this department is in charge of:
■defining the steering indicators and overall stress test scenarios of the different types of structural risks and setting the main limits for the business divisions and the entities and Business Units (BU)/Service Units (SU);
Finally, the Risk Department chairs the Group model validation Committee and the Group ALM norms validation Committee.
Each entity, each BU/SU, manages its structural risks and is responsible for regularly assessing risks incurred, producing the risk report and developing and implementing hedging options. Each entity, each BU/SU is required to comply with Group standards and to adhere to the limits assigned to it.
As such, the entities and the BUs/SUs apply the standards defined at Group level and develop the models, with the support of the central modelling teams of the Finance Department.
An dedicated ALM manager reporting to the Finance Department in each entity, BU/SU, is responsible for monitoring these risks (first-level control). This manager is responsible for reporting ALM risks to the Group Finance Department. All entities, BU/SU, have an ALM Committee responsible for implementing validated models, managing exposure to interest rate and exchange rate risks and implementing hedging programmes in accordance with the principles set out by the Group and the limits validated by the Finance Committee and the BU/SU ALM Committees.
-
11.2 STRUCTURAL INTEREST RATE RISK
Structural interest rate risk is generated by commercial transactions and their hedging, as well as the management operations specific to each of the consolidated entities.
The objective of managing structural interest rate risk is to reduce of exposure of each Group entity as much as possible.
To this end, the Board of Directors, the Finance Committee and the ALM Committee set sensitivity limits (in terms of value and income) for the Group, the BUs/SUs and the entities respectively.
■the sensitivity of the net present value (NPV) to the risk of interest rate mismatch. It is measured as the sensitivity of the net present value of the static balance sheet to a change in interest rates. This measure is calculated for all currencies to which the Group is exposed;
■the sensitivity of the interest margin to changes in interest rates in various interest rate scenarios. It takes into account the sensitivity generated by future commercial production;
■the sensitivity of NPV to basis risk (risk associated with decorrelation between different variable rate indices).
Limits on these indicators are applicable to the Group, the BUs/SUs and the various entities. Limits are set for shocks at +/-0.1% and for stressed shocks (+/-1% for value sensitivity and +/-2% for income sensitivity) without floor application. Only the sensitivity of income over the first two years is framed. The measurements are computed monthly 10 months a year (with the exception of the months of January and July for which no Group-level closing is acheved). An additional synthetic measurement of value sensitivity – all currencies – is framed for the Group. To comply with these frameworks, the entities combine several possible approaches:
■orientation of the commercial policy so as to offset interest rate positions taken on the asset and liability side;
■implementation of a swap operation or – failing this in the absence of such a market – use of a loan/borrowing operation;
Assets and liabilities are analysed without a prior allocation of resources to uses. Maturities of outstanding amounts are determined by taking into account the contractual characteristics of the transactions, adjusted for the results of customer behaviour modelling (in particular for demand deposits, savings and early loan repayments), possibly differentiated according to the rate scenario considered, as well as a certain number of disposal agreements, in particular on equity items.
As of December 31, the modeling of deposits with no maturity date, sometimes integrating a dependence on the rate level, leads to an average duration of 4.5 years, with a maximum duration of 20 years.
Changes in OCI or P&L of instruments recognised at fair value are not included in the controlled income sensitivity measures.
Hedging transactions are mainly documented from an accounting viewpoint: this can be carried out either as micro-hedging (individual hedging of commercial transactions and hedging instruments) or as macro-hedging under the IAS 39 “carve-out” arrangement (global backing of portfolios of similar commercial transactions within a Treasury Department; macro-hedging concerns essentially French retail network entities).
Macro-hedging derivatives are essentially interest rate swaps in order to maintain networks’ net asset value and result sensitivity within limit frameworks, considering hypotheses applied. For macro-hedging documentation, the hedged item is an identified portion of a portfolio of commercial client or interbank operations. Conditions to respect in order to document hedging relationships are reminded in Note 3.2 to the consolidated financial statements.
Macro-hedging derivatives are allocated to separate portfolios according to whether they are used to hedge fixed-rate assets or liabilities in the accounting books. The hedging instrument portfolios allocated to liability elements are net fixed-rate receiver/variable-rate payer whereas the hedging instrument portfolios allocated to asset elements are net fixed-rate payer/variable-rate receiver.
The non-over-hedging tests and hedged items non-disappearing tests make the link between the balance sheet available assets or liabilities outstanding and the amount of assets and liabilities outstanding designated as hedged. The prospective non-over-hedging test is satisfied when the net outstanding amount of the swaps is lower for each maturity band and on each measurement date than the determined outstanding amount of items eligible to fair value hedge. The estimated outstanding may be defined as the outstanding amount resulting from ALM projections. The non-over-hedging a posteriori test is performed in two stages: the first stage is the same as the a priori test but on the outstanding amount eligible to fair value hedge on closing date, new production excluded, then the second stage is called the non-disappearance of the hedged item test and consists in verifying that the hedgeable position is always at least as significant as the maximum position that had initially been hedged.
The effectiveness of the hedge is then determined using the dollar offset method. The sources of ineffectiveness result from the last fixing of the variable leg of the hedging swaps, the bi-curve valorisation of the collateralised hedging instruments, possible mismatches in the cash flows payment dates and counterparty risk on hedging instruments valorisation.
The Group’s sensitivity to VAN as at 31 December 2021 is EUR -20 million (for an instantaneous and parallel increase in interest rates of 0.1%).
The regulatory metrics are calculated in a similar way to the value sensitivity management metrics, exceptions made:
■conventions used to dispose of equity and equity securities (10-year linear flow for management metrics while their sensitivity is zero for regulatory EVE sensitivity metrics);
■specific provisions imposed by the regulator (EBA GL 2018/02, §113, §114, §115 and §116) and in particular the discounting carried out at a risk-free rate for the entire balance sheet.
The Group analyses the sensitivity of the net interest margin to changes in market interest rates through stress tests on the Group’s net interest margin under constant balance sheet and under forward balance sheet assumptions.
The measurement of the sensitivity of the net interest margin to a three-year horizon in different configurations of the yield curve is used by the Group to monitor the interest rate risk on a perimeter of significant entities.
The balance sheet in a dynamic approach evolves according to the amortisation of the stock and the renewals of operations on the basis of the outstanding amounts booked at the closing date.
The sensitivity of the Group’s net interest margin over the next three full years is low. In the event of a parallel rise in the yield curve of +10 bps, it is positive and represents approximately 1% of net banking income.
■customer deposits: generally low or non-interest-bearing, with customer rates only partially impacted by interest rate changes, their margin is mainly the result of the replacement rate;
The sensitivity of the margin on the stock of customer transactions results from the renewal of matured tranches of deposit replacements and the residual sensitivity of the balance sheet to interest rate changes.
French Retail Banking’s activities in France and abroad are favourably exposed by a rise in interest rates over the first three years enabling them to replace their deposits at higher rates, with the margin on loans in stock remaining stable. However, this increase in margin is partially offset by higher refinancing costs.
Retail Banking activities are unfavourably exposed to the decrease in rates as their deposits are then replaced at lower rates and the margin on loans in stock decreases due to early repayments. This decline in margin was partially offset by lower refinancing costs.
Calculations are based on the aggregate estimates as at 31 December of consolidated entities of the Group.
The shocks used to compute EVE and NII amounts of sensitivities featured in this table correspond to “Parallel up”, “Parallel down”, “Steepener”, “Flattener”, “Short rates up” and “Short rates down” scenarios as defined in EBA guidelines (EBA/GL/2018/02), paragraph 114, with applicable floor as described in 115(k), that is -100 bps for overnight tenor and 0 bp for 20Y tenor.
The EVE sensitivity amount computation follows the other subparagraphs of the aforementioned EBA guidelines, paragraph 115.
-
11.3 STRUCTURAL EXCHANGE RATE RISK
Structural exchange rate risk, understood as resulting from all transactions that do not belong to the Trading Book, results from:
■exposures related to net investments abroad in foreign currencies, i.e. in subsidiaries and branches. FX positions generated by an imperfect hedge are valued through other comprehensive income;
■exposures related to activities made by entities in currencies that are not their reporting currency.
The Group’s policy is to make the CET1 ratio insensitive to fluctuations in exchange rates against the euro.
As at 31 December 2021, it amounted to 13.55% (without IFRS 9 phasing). Of the EUR 363 billion in RWA, EUR 111 billion relate to exposures in currencies other than the euro.
■Group entities are asked to individually hedge the results related to activities in currencies other than their reporting currency;
■the exposures related to net investments in foreign currencies and the associated net results are partially hedged at central level. A position in each foreign currency generating RWA is intentionally maintained open by the Finance department at the Group CET1 ratio targeted level. Hedges are realised using cash lending and borrowing, forward and swap instruments in the subsidiaries’ currencies and accounted for as net investment hedges (see Note 3.2);
■the Group’s net consolidated structural foreign exchange position as at 31 December 2021 is equivalent to EUR 12,832 million, of which 45% comes from the USD, and around 79% is concentrated in six currencies: USD, GBP, RUB, CZK, MAD and XOF.
For each currency, the difference between actual and target exposure is governed by limits validated by the General Management in Finance Committee and the Board of Directors.
Impact of a 10% currency depreciation on the
Common Equity Tier 1 ratio
Impact of a 10% currency appreciation on the
Common Equity Tier 1 ratio
Currency
31.12.2021
31.12.2020
31.12.2021
31.12.2020
GNF
(0.1)
(0.1)
0.1
0.1
HKD
0.2
(0.1)
(0.2)
0.1
XPF
0.3
0.3
(0.3)
(0.3)
CZK
0.4
(0.1)
(0.4)
0.1
RON
0.4
(0.1)
(0.4)
0.1
RUB
0.5
0.3
(0.5)
(0.3)
GBP
0.5
0.7
(0.5)
(0.7)
XAF
0.6
0.7
(0.6)
(0.7)
USD
0.8
0.8
(0.8)
(0.8)
Others
0.1
1.1
0.1
(0.9)
-
12 LIQUIDITY RISK
Liquidity risk is defined as the Group’s inability to meet its financial obligations at a reasonable cost. Funding risk is defined as the risk of the Group being unable to finance the development of its activities in line with its commercial objectives and at a competitive cost.
Liquidity reserve at end 2021
EUR 229bn
(Amount at end 2020: EUR 243bn)
Liquidity risk is defined as the risk that the bank cannot meet its financial obligations. It is measured across different time horizons, under various assumptions (normal conditions and stressed scenarios). Funding risk is defined as the risk that the Group cannot maintain over time the appropriate amount of funding to support its assets and at a reasonable cost.
-
12.1 OBJECTIVES AND GUIDING PRINCIPLES
The liquidity and funding management set up at Societe Generale aims at ensuring that the Group can (i) fulfil its payment obligations at any moment in time, during normal course of business or under lasting financial stress conditions (management of liquidity risks) ; (ii) raise funding resources in a sustainable manner, at a reasonable cost (management of funding risks). Doing so, the liquidity and funding management set up ensures that both regulatory requirements and the risk appetite set by the Group are met.
■mutualising resources, optimising costs and ensuring consistent risk management by centralising liquidity and funding management at the Corporate centre level, mainly in the name of the mother company (Societe Generale SA). For that purpose, Business Units have tight constraints in terms of the transformation position they can run, hence need to match their assets and liabilities by transacting with the Corporate centre, along a Funds Transfer Pricing mechanism. Assets or liabilities which do not have a set contractual maturity (e.g. sight deposits) have their maturity assessed along quantitative models or conventions proposed by the Finance Division and by the Business Units and validated by the Risk Division (see below);
■planning for funding resources in consideration of both the business development objectives and the risk appetite set by the Board of Directors. See below the “Funding Plan” chapter in section 2;
■ensuring that funding risks are mitigated through a proper diversification of funding resources in terms of currencies, investor pools, maturity buckets, liability format (e.g. benchmark bond issuance, with a split along various seniority levels, issuance in the form of structured notes, issuance in the form of unsecured and secured notes). In order to optimise funding costs, the majority of bond issuance is made in the name of the mother company. However, a degree of diversification is sought by leveraging the capacity of some subsidiaries to raise funds in a way which complements the mother company’s funding, i.e. raising funds from local investors in local currencies;
■ensuring that Societe Generale keeps liquid reserves in sufficient amount to comply with the survival horizon under stress set by the Board of Directors. Liquid reserves are in the form of cash held at central banks and highly liquid securities, split between the Banking Book (under the direct or indirect ownership of the Group Treasury Department) or the Trading Book (mainly within the Global Markets division, under a permanent control of the Group Treasury Department);
■ensuring Societe Generale has readily available remediation options to face potential stress situations, through a Group-wide contingency plan (which leaves aside insurance activities, which have their separate contingency arrangements) aimed at detecting any stress signals at an early stage and defining in advance the crisis management setup and mitigation options.
-
12.2 OPERATIONAL IMPLEMENTATION
■risk identification is a process which is set out and documented by the Risk Division, in charge of establishing a mapping of liquidity risks. This process is conducted yearly with each Business Unit and within the Group Treasury Department, aimed at screening all material risks and checking their proper measurement and capturing the control framework. In addition, a Reverse Stress Testing process exists, which aims at identifying and quantifying the risk drivers which may weigh most on the liquidity profile under assumptions even more severe than used in the regular stress test metrics;
■definition, implementation and periodic review of liquidity models and conventions used to assess the duration of assets and liabilities without a set contractual maturity and to assess the liquidity profile under stress. Liquidity models are managed along the overall Model Risk Management governance, also applicable to other risk factors (market, credit, operational), controlled by the Group Risk division;
■definition of risk appetite: The Board of Directors validates, on the proposal of General Management, the limits and associated alert thresholds, which are then applied to the businesses. Liquidity risk risk appetite covers the following metrics:
-the survival horizon under an adverse stress scenario, combining a severe market and systemic shock and an idiosyncratic shock. In addition to the main adverse scenario, Societe Generale also checks its survival horizon under an extreme stress scenario. For both scenarios, the idiosyncratic shock is characterised by one of its main consequences, which would be an immediate 3-notch downgrade of Societe Generale’s long-term rating. In such adverse or extreme scenarios, the liquidity position of the Group is assessed over time, taking into account the negative impacts of the scenarios, such as deposit outflows, drawing by clients of the committed facilities provided by Societe Generale, increase in margin calls related to derivatives portfolios, etc. The survival horizon is the moment in time when the net liquidity position under such assumptions becomes negative,
-the overall transformation position of the Group (proper matching of assets and liabilities, in tenors up to 5 years),
-the amount of free collaterals providing an immediate access to central bank funding, in case of an emergency (only collaterals which do not contribute to the numerator of the LCR are considered, i.e. non-HQLA collaterals);
■the financial trajectories under baseline and stressed scenarios are determined within the framework of the funding plan to respect the risk appetite. The budget’s baseline scenario reflects the central assumptions for the macro-economic environment and the business strategy of the Group, while the stressed scenario is factoring both an adverse macro-economic environment and idiosyncratic issues;
■the funding plan comprises both the long-term funding programme, which frames the issuance of plain vanilla bonds and structured notes, and the plan to raise short-term funding resources in money markets;
■maintenance by the Group Treasury Department and validation by the Finance Committee of a Funds Transfer Pricing framework, aimed at making funding grids available at any time for Business Units to transact with the Corporate center to upstream their liquidity surplus or borrow cash so that they fund their activities within their transformation position limits;
■production and broadcasting of periodic liquidity reports, at various frequencies (daily indicators, weekly indicators, monthly indicators), leveraging in most part on the central data repository, operated by a dedicated central production team. The net liquidity position under the combined (idiosyncratic and market/systemic) stress scenario is reassessed on a weekly basis and can be analysed along multiple axes (per product, Business Unit, currency, legal entity). Each key metric (LCR, NSFR, transformation positions, net liquidity position under combined stress) is reviewed formally on a monthly basis by the Group Finance and Risk divisions. Forecasts are made and revised weekly by the Strategic and Financial Steering Department and reviewed during a Weekly Liquidity Committee chaired by the Head of Group Treasury. This Weekly Liquidity Committee gives tactical instructions to Business Units, with the objective to adjust in permanence the liquidity and funding risk profile, within the limits and taking into account business requirements and market conditions;
■preparation of a Contingency Funding Plan, which is applicable Group-wide, and provides for: (i) a set of early warning indicators (e.g. market parameters or internal indicators); (ii) the operating model and governance to be adopted in case of an activation of a crisis management mode (and the interplay with other regimes, in particular Recovery management); (iii) the main remediation actions to be considered as part of the crisis management.
These various operational steps are part of the ILAAP (Internal Liquidity Adequacy Assessment Process) framework of Societe Generale.
Every year, Société Générale produces for its supervisor, the ECB, a self-assessment of the liquidity risk framework in which key liquidity and funding risks are identified, quantified and analysed with both a backward and a multi-year forward-looking perspective. The adequacy self-assessment also describes qualitatively the risk management set up (methods, processes, resources…), supplemented by an assessment of the adequacy of the Group’s liquidity.
-
12.3 GOVERNANCE
-sets yearly the level of liquidity risk tolerance as part of the Group’s risk appetite, based on a set of key metrics, which includes both internal and regulatory metrics, in particular the period of time during which the Group can operate under stressed conditions (“survival horizon”),
-approves budget targets, including targets related to scarce resources such as liquidity usage and funding (definition of the funding plan),
-reviews at least quarterly the Group’s liquidity and funding situation: key liquidity metrics, specifically stressed liquidity gap metrics as evaluated through Société Générale Group models, the regulatory metrics LCR and NSFR, the pace of execution of the funding plan and the related cost of funds;
-allocates liquidity and funding targets to the various Business Units and the Group Treasury entity, upon proposal from the Group Finance division,
-defines and implements the liquidity and funding risk strategy, based on inputs from the Finance and Risk Divisions and the Business Units. In particular, the General Management chairs the Finance Committee, held every 6 weeks and attended by representatives from the Finance and Risk Divisions and Business Units, which is responsible for monitoring structural risks and managing scarce resources:
•definition of principles and methods related to liquidity risk management (e.g. definition of stress scenarios),
■the Group Finance Division, which is responsible for the liquidity and funding risks as First Line of Defense, interacting closely with Business Units. Within the Group Finance Division, there are three main departments involved respectively in the preparation and implementation of decisions taken by the abovementioned bodies:
-the Strategic and Financial Steering Department is responsible for framing and overseeing management of the Group’s scarce resources, including liquidity, within the Group’s risk appetite and budget targets,
-the Group Treasury Department is in charge of all aspects of the operational management of liquidity and funding across the Group, including managing the liquidity position, executing the funding plan, supervising and coordinating treasury functions, providing operational expertise in target setting, managing the liquidity reserves and the collateral used in funding transactions, managing the corporate centre,
-the Asset and Liability Management Department is in charge of modelling and monitoring structural risks, including liquidity risk alongside interest rate and foreign exchange risks in the Banking Book;
■also sitting with the Group Finance Division, the Metrics Production Department runs the management information system regarding liquidity and funding risks across the Group. For liquidity metrics, the Group relies on a centralised system architecture, with all Business Units feeding a central data repository from which all metrics are produced, either regulatory metrics (e.g. the LCR or the NSFR) or metrics used for internal steering (e.g. stress test indicators);
■the ALM Risk Department, which performs all second line of defense functions, in particular leads the risk identification process, designs the structure and the calibration of the liquidity and funding risks control framework and monitors compliance with related thresholds and limits. It also validates liquidity models and conventions.
-
12.4 ASSET ENCUMBRANCE
An asset shall be treated as encumbered if it has been pledged or if it is subject to any form of arrangement to secure, collateralise or credit enhance any transaction from which it cannot be freely withdrawn.
Total Group encumbrance amounts to 35% over 2021, measured according to the EBA definition(1). Securities encumbrance is 74%, while loan encumbrance is 16%.
The majority of the Group’s encumbered assets (around 78%) is in the form of securities as a result of the relative size of capital market activities, mainly through repos, reverse repos and collateral swaps.
Securities encumbrance is concentrated in SGPM and its branches, where Group market activities are located.
The main sources of encumbrance are repo operations and debt securities issued. Encumbrance on assets in US dollars stems mainly from debt securities.
The level of encumbered loans varies among Group entities mainly due to their respective business models, funding strategies and the type of underlying loans, as well as to the law governing them. The main sources of loans encumbrance are in euros and to a lesser extent in US dollars. A few points are noteworthy:
■at SGPM level, the loan encumbrance rate amounts to close to 32%(2) at 2021 year-end, stemming mainly from housing loans. Encumbered loans are affected as collateral for the ECB’s TLTRO operations as well as long-term refinancing mechanisms which are broadly used by banks for covered bonds (SG SFH, SG SCF and CRH), securitisations or specific mechanisms;
■at subsidiary level, the loan encumbrance rate stands at 23%(2) overall, with discrepancies between entities due to different funding strategies. The highest levels of secured funding correspond to entities which contribute to the pooling scheme (see below) or having implemented external funding programmes through securitisations such as BDK (Bank Deutsches Kraftfahrzeuggewerbe) and ALD, or other forms of secured funding. Besides, some subsidiaries (Crédit du Nord) have participated directly in TLTRO operations, which in turn impacted their loan encumbrance rate.
As far as the loan encumbrance is concerned, there is a pooling scheme in which Crédit du Nord, Boursorama and to a lesser extent BFCOI (Réunion) bring a share of their housing loans portfolio to the Group. The surplus of loans encumbrance stemming from intra-group transactions represent approximately 31% of the total Group loans encumbrance.
Regarding major long-term secured funding mechanisms, over-collateralisation on covered bond vehicles was 130% on SG SCF and 114% on SG SFH as at 31 December 2021.
The unencumbered “Other assets” (excluding loans) include all derivatives and options products (interest rate swaps, cross currency swaps, currency options, warrants, futures, forward contracts…) as well as some assets that cannot be encumbered in the normal course of business. These assets include goodwill, fixed assets, deferred tax, adjustment accounts, sundry debtors and other assets.
(2)According to a methodology consisting of encumbering the least liquid eligible assets (encumbered loans/total loans) first.
(In EURm)
31.12.2021(1)
Carrying amount of
encumbered assetsFair value of
encumbered assetsCarrying amount of
unencumbered assetsFair value of
unencumbered assetsof which:
EHQLA &
HQLAof which:
EHQLA &
HQLAof which:
EHQLA &
HQLAof which:
EHQLA &
HQLAAssets of the reporting institution
253,755
94,731
1,087,854
226,154
Equity instruments
76,424
58,720
76,424
58,720
48,946
16,193
48,946
16,193
Debt securities
39,838
36,010
39,838
36,010
61,276
41,592
61,276
41,592
of which: covered bonds
135
101
135
101
274
224
274
224
of which: asset-backed securities
130
74
130
74
3,262
60
3,262
60
of which: issued by general governments
34,611
34,104
34,611
34,104
31,770
31,770
31,770
31,770
of which: issued by financial corporations
3,052
1,345
3,052
1,345
18,816
3,685
18,816
3,685
of which: issued by non-financial corporations
2,256
587
2,256
587
9,183
397
9,183
397
Other asset
138,329
-
973,492
169,936
of which: Loans on demand
5,477
-
-
-
196,750
166,301
-
-
of which: Loans and advances other than loans on demand
131,769
-
-
-
513,061
1,282
-
-
of which: other
1,719
-
-
-
257,793
2,373
-
-
(1)Table’s figures are calculated as medians of the four quarters across 2021.
(In EURm)
31.12.2020(1)
Carrying amount of
encumbered assetsFair value of
encumbered assetsCarrying amount of
unencumbered assetsFair value of
unencumbered assetsof which:
EHQLA &
HQLAof which:
EHQLA &
HQLAof which:
EHQLA &
HQLAof which:
EHQLA &
HQLAAssets of the reporting institution
193,360
58,192
1,119,295
196,192
Equity instruments
30,726
23,708
35,624
11,631
Debt securities
36,404
32,617
36,404
32,617
65,884
45,498
65,884
45,498
of which: covered bonds
85
21
85
21
221
206
221
206
of which: asset-backed securities
131
107
131
107
1,737
54
1,737
54
of which: issued by general governments
32,196
31,113
32,196
31,113
39,877
39,877
39,877
39,877
of which: issued by financial corporations
2,101
721
2,101
721
14,848
4,339
14,848
4,339
of which: issued by non-financial corporations
1,939
558
1,939
558
5,927
422
5,927
422
Other asset
124,074
838
1,018,810
142,845
of which: Loans on demand
5,078
-
-
-
172,646
138,391
-
-
of which: Loans and advances other than loans on demand
117,365
838
-
-
550,028
1,554
-
-
of which: other
1,431
-
-
-
296,136
2,251
-
-
(1)Table’s figures are calculated as medians of the four quarters across 2020.
(In EURm)
31.12.2021(1)
Fair value of encumbered collateral received or
own debt securities issuedFair value of collateral received or own debt
securities issued available for encumbranceof which:
EHQLA
& HQLA(1)of which:
EHQLA
& HQLA(1)Collateral received by the reporting institution
371,005
318,340
63,028
46,853
Loans on demand
-
-
-
-
Equity instruments
77,453
45,080
12,019
5,765
Debt securities
294,793
271,918
51,145
41,326
of which: covered bonds
2,490
990
4,237
3,948
of which: asset-backed securities
4,292
2,357
3,835
707
of which: issued by general governments
270,974
265,510
39,288
35,895
of which: issued by financial corporations
15,449
2,975
9,284
4,155
of which: issued by non-financial corporations
8,642
3,484
2,096
716
Loans and advances other than loans on demand
-
-
-
-
Other collateral received
-
-
-
-
Own debt securities issued other than own covered bonds or asset-backed securities
1,602
-
29
-
Own covered bonds and asset-backed securities issued and not yet pledged
8,253
-
TOTAL ASSETS, COLLATERAL RECEIVED AND OWN DEBT SECURITIES ISSUED
625,152
413,070
-
-
(1)Table’s figures are calculated as medians of the four quarters across 2021.
(In EURm)
31.12.2020(1)
Fair value of encumbered collateral received or
own debt securities issuedFair value of collateral received or own debt
securities issued available for encumbranceof which:
EHQLA
& HQLA(1)of which:
EHQLA
& HQLA(1)Collateral received by the reporting institution
350,885
307,935
72,179
57,800
Loans on demand
-
-
-
-
Equity instruments
60,252
40,614
12,003
7,246
Debt securities
291,988
268,785
57,003
48,598
of which: covered bonds
2,318
1,213
7,286
6,878
of which: asset-backed securities
7,019
4,049
3,033
216
of which: issued by general governments
267,274
262,019
43,078
40,929
of which: issued by financial corporations
15,655
2,448
12,420
7,074
of which: issued by non-financial corporations
10,168
5,254
2,359
542
Loans and advances other than loans on demand
-
-
-
-
Other collateral received
-
-
-
-
Own debt securities issued other than own covered bonds or asset-backed securities
-
-
796
-
Own covered bonds and asset-backed securities issued and not yet pledged
10,259
-
TOTAL ASSETS, COLLATERAL RECEIVED AND OWN DEBT SECURITIES ISSUED
557,598
373,512
-
-
(1)Table’s figures are calculated as medians of the four quarters across 2020.
(In EURm)
31.12.2021(1)
Matching liabilities, contingent
liabilities or securities lentAssets, collateral received
and own debt securities issued other
than covered bonds
and ABSs encumberedCarrying amount of selected financial liabilities
402,302
424,769
(1)Table’s figures are calculated as medians of the four quarters across 2021.
(In EURm)
31.12.2020(1)
Matching liabilities, contingent
liabilities or securities lentAssets, collateral received
and own debt securities issued other
than covered bonds
and ABSs encumberedCarrying amount of selected financial liabilities
361,249
380,460
(1)Table’s figures are calculated as medians of the four quarters across 2020.
-
12.5 LIQUIDITY RESERVE
The Group’s liquidity reserve encompasses cash at central banks and assets that can be used to cover liquidity outflows under a stress scenario. The reserve assets are available, i.e. not used in guarantee or as collateral on any transaction. They are included in the reserve after applying a haircut to reflect their expected valuation under stress. The Group’s liquidity reserve contains assets that can be freely transferred within the Group or used to cover subsidiaries’ liquidity outflows in the event of a crisis: non-transferable excess cash (according to the regulatory ratio definition) in subsidiaries is therefore not included in the Group’s liquidity reserve.
■High-Quality Liquid Assets (HQLAs), which are securities that can be quickly monetised on the market via sale or repurchase transactions; these include government bonds, corporate bonds and equities listed on major indices (after haircuts). These HQLAs meet the eligibility criteria for the LCR, according to the most recent standards known and published by regulators. The haircuts applied to HQLA securities are in line with those indicated in the most recent known texts on determining the numerator of the LCR;
■non-HQLA Group assets that are central bank-eligible, including receivables as well as covered bonds and securitisations of Group receivables held by the Group.
The composition of the liquidity reserve is reviewed regularly by a special committee comprising the Finance Division, the Risk Division and the Management of the Market Business Unit, and is adjusted by authorisation of the Finance Committee.
-
12.6 REGULATORY RATIOS
The Basel Committee recommends the international implementation of two standard ratios with harmonised parameters to regulate bank liquidity risk profiles:
■the Liquidity Coverage Ratio (LCR) aims to ensure that banks hold sufficient liquid assets or cash to survive a significant stress scenario combining a market crisis and a specific crisis and lasting for one month;
■the Net Stable Funding Ratio (NSFR) is a transformation ratio which compares funding needs with stable resources over a one-year period.
The European transposition of Basel 3, CRD4 and CRR1 published on 27 June 2013 has been amended by Directive 2019/878 of the European Parliament and of the Council of 20 May 2019 (CRD5) and the Capital Requirements Regulation: Regulation (EU) 2019/876 of the European Parliament and of the Council of 20 May 2019 (CRR2). Its French version was published in the Official Journal on 7 June 2019.
The LCR regulation issued on 10 October 2014 has since been updated by a Delegated Act which entered into force on 30 April 2020. The corresponding minimum requirement was set at 100% from 1 January 2018.
The NSFR requirement included in the CRR2 (EU) 2019/876 of 20 May 2019 entered into force in June 2021. The required level stands at 100%.
The Group manages its liquidity risk through the LCR, the NSFR and liquidity gaps, under stress and under normal conditions of activity, and accumulated (all currencies combined), and this, by making sure at any time that the liquidity is transferable across the main currencies. The management has been enriched with USD dedicated metrics.
Since the implementation of the European regulatory LCR requirement in October 2015, Societe Generale’s LCR has consistently stood at over 100%. The LCR was 129% at end-2021 (vs. 149% at end-2020). Since the NSFR intered into force, it has consistently stood at over 100% and stands at 110% at end-2021.
The LCR regulatory requirement must be respected by the Group in all currencies but it is also reported in the major currency in US dollars. The Group assessment performed on potential currency mismatches between liquid assets and net outflows uses a metric, namely the “adjusted LCR excess in USD(1)” to complement the LCR in all currencies. This metric remained positive throughout 2021.
(1)“Adjusted” means after removal of the regulatory caps and regulatory asymmetry between the cross currency collateral swaps and the FX swaps.
The liquidity coverage ratio is calculated as the simple average of month-end observations over the twelve months preceding the end of each quarter.
The table featured hereinafter takes into account some modifications of historical data, notably aiming at a better alignment with the technical instructions emanating from the European Banking Authority (EBA/ITS/2020/04).
Prudential Group
(In EURm)
Total unweighted value
(in average)
Total weighted value
(in average)
Quarter ending on
31.12.2021
30.09.2021
30.06.2021
31.03.2021
31.12.2021
30.09.2021
30.06.2021
31.03.2021
High-quality liquid assets
Total high-quality liquid assets (HQLA)
229,464
228,704
224,460
217,669
Cash – Outflows
Retail deposits and deposits from small business customers, of which:
223,282
220,773
218,159
215,584
17,669
17,276
16,875
16,519
Stable deposits
121,021
121,548
121,919
122,372
6,051
6,077
6,096
6,119
Less stable deposits
96,373
92,712
88,978
85,271
11,604
11,185
10,764
10,383
Unsecured wholesale funding
279,852
272,195
264,759
261,917
151,095
147,592
142,847
139,988
Operational deposits (all counterparties) and deposits in networks of cooperative banks
66,849
63,013
60,152
61,289
16,249
15,303
14,599
14,861
Non-operational deposits (all counterparties)
195,838
189,898
185,605
182,737
117,680
113,006
109,246
107,235
Unsecured debt
17,165
19,284
19,002
17,891
17,165
19,284
19,002
17,891
Secured wholesale funding
100,549
92,263
84,329
80,341
Additional requirements
185,554
181,881
179,052
177,427
62,211
60,701
60,001
59,484
Outflows related to derivative exposures and other collateral requirements
32,319
32,560
33,555
34,760
30,735
31,097
32,062
33,047
Outflows related to loss of funding on debt products
9,116
7,747
6,749
5,754
9,116
7,747
6,749
5,754
Credit and liquidity facilities
144,119
141,574
138,748
136,914
22,360
21,858
21,190
20,683
Other contractual funding obligations
62,574
61,787
60,547
59,679
62,574
61,787
60,547
59,679
Other contingent funding obligations
53,855
50,854
48,668
46,167
963
1,075
1,263
1,177
TOTAL CASH OUTFLOWS
395,060
380,694
365,861
357,186
Cash – inflows
Secured lending (eg reverse repos)
282,077
278,706
271,463
271,259
89,005
85,626
84,391
87,024
Inflows from fully performing exposures
45,567
42,604
40,431
39,690
38,451
35,710
33,693
32,733
Other cash inflows
101,286
99,122
99,976
101,418
98,693
96,921
97,793
99,203
(Difference between total weighted inflows and total weighted outflows arising from transactions in third countries where there are transfer restrictions or which are denominated in non-convertible currencies)
-
-
-
-
(Excess inflows from a related specialised credit institution)
-
-
-
-
TOTAL CASH INFLOWS
428,930
420,432
411,870
412,367
226,148
218,257
215,876
218,961
Fully exempt Inflows
-
-
-
-
-
-
-
-
Inflows subject to 90% cap
-
-
-
-
-
-
-
-
Inflows subject to 75% cap
331,124
331,622
331,324
335,981
226,148
218,257
215,876
218,961
TOTAL ADJUSTED VALUE
LIQUIDITY BUFFER
229,105
228,527
224,304
217,669
TOTAL NET CASH OUTFLOWS
168,912
162,438
149,984
138,226
LIQUIDITY COVERAGE RATIO (%)
135.78%
141.15%
151.41%
159.23%
As at 31 December 2021, the average of Societe Generale’s LCR stood at 136% (arithmetic average of the 12 LCR monthly values from January 2021 to December 2021, in accordance with the prudential disclosure requirement emanating from Regulation (EU) No 2019/876).
Reported LCR was 129% as at 31 December 2021, or EUR 51 billion of liquidity surplus over the regulatory requirement of 100%. This compares to 149%, or EUR 78 billion of liquidity surplus, as at 31 December 2020. The LCR numerator was EUR 226 billion as at 31 December 2021, decreasing by EUR 10 billion compared with 31 December 2020, reflecting a change in the structure of securities inventories in capital markets. The net cash outflows increased by EUR 16 billion over the same period, mainly as a result of the growth of corporate deposits in the French retail networks.
As at 31 December 2021, the numerator of the LCR included EUR 168 billion of withdrawable central bank reserves (74%) and EUR 48 billion of Level 1 high-quality securities (21%), as well as 4% of Level 2 or assimilated. The LCR numerator, which amounted to EUR 236 billion as at 31 December 2020, contained withdrawable central bank reserves and Level 1 high-quality securities representing 97% of the buffer.
The euro accounted for 61% of Societe Generale’s total high-quality liquid assets as at 31 December 2021. Among other currencies, only the US dollar accounted for more than 5% of liquid assets, with a weight of 20%. The liquidity profile of the Group in US dollars is framed by a set of thresholds and metrics, including indicators of liquidity excess under stress, in US dollars.
Societe Generale impacts its LCR computation to factor in collateral needs for covered bonds issuance vehicles and other vehicles used in capital markets activities, in case of a 3-notch downgrade of Societe Generale’s credit rating. Societe Generale also impacts its LCR computation to factor in a potential adverse market shock based on a 24-month historical look-back approach.
Societe Generale ensures it does not overly rely on any given individual counterparty or segment by setting and monitoring concentration risk metrics on secured and unsecured markets. For instance, unsecured short-term funding is subject to thresholds by counterparty type (Corporates, Central banks, Public sector, Asset managers, etc). Secured funding is framed to ensure that the drying up of liquidity in any segment of the repo market (counterparty segments, underlying collateral segments, currencies) would not materially impair the refinancing of inventories in capital markets. In addition to this, the Group’s long-term funding is structurally diversified. The plain vanilla funding programme is split into various currencies, instruments and geographies and seeks to continuously expand the investor base. Structured issuances are highly granular (multiple distributing networks) and provide a diversification in terms of nature of investors.
Intraday funding requirements give rise to dedicated reserves which are taken into account when computing liquidity stress tests based on internal models, which ground the control of the Societe Generale Group survival horizon under stress.
(In EURm)
31.12.2021
Unweighted value by residual maturity
Weighted
value
No maturity
< 6 months
6 months
to < 1yr
≥ 1yr
Available stable funding (ASF) Items
Capital items and instruments
65,176
124
42
11,781
76,957
Own funds
65,176
124
42
11,781
76,957
Other capital instruments
-
-
-
-
Retail deposits
229,237
2,048
5,565
220,009
Stable deposits
125,085
667
3,564
123,028
Less stable deposits
104,152
1,381
2,000
96,981
Wholesale funding:
480,196
35,761
191,894
322,247
Operational deposits
75,157
2
3
37,583
Other wholesale funding
405,039
35,759
191,891
284,664
Interdependent liabilities
64,523
3
2,493
-
Other liabilities:
-
77,444
70
193
228
NSFR derivative liabilities
-
All other liabilities and capital instruments not included in the above categories
77,444
70
193
228
TOTAL AVAILABLE STABLE FUNDING (ASF)
619,442
Required stable funding (RSF) Items
Total high-quality liquid assets (HQLA)
32,405
Assets encumbered for more than 12m in cover pool
146
76
56,405
48,133
Deposits held at other financial institutions for operational purposes
-
-
-
-
Performing loans and securities:
217,968
54,599
356,253
380,874
Performing securities financing transactions with financial customerscollateralised by Level 1 HQLA subject to 0% haircut
62,650
8,870
2,075
8,345
Performing securities financing transactions with financial customer collateralised by other assets and loans and advances to financial institutions
59,942
10,030
24,736
35,480
Performing loans to non- financial corporate clients, loans to retail and small business customers, and loans to sovereigns,
and PSEs, of which:63,417
28,500
199,251
230,399
With a risk weight of less than or equal to 35% under the Basel II Standardised Approach for credit risk
10,981
2,244
21,116
32,941
Performing residential mortgages, of which:
4,303
5,278
95,955
69,891
With a risk weight of less than or equal to 35% under the Basel II Standardised Approach for credit risk
3,843
4,798
82,308
57,821
Other loans and securities that are not in default and do not qualify as HQLA, including exchange-traded equities and trade finance on-balance sheet products
27,656
1,921
34,236
36,759
Interdependent assets
64,523
3
2,493
-
Other assets:
-
70,198
1,155
81,941
90,158
Physical traded commodities
-
-
Assets posted as initial margin for derivative contracts and contributions to default funds of CCPs
4,102
-
20,295
20,737
NSFR derivative assets
2,187
2,187
NSFR derivative liabilities before deduction of variation margin posted
41,318
2,066
All other assets not included in the above categories
22,592
1,155
61,646
65,168
Off-balance sheet items
189,458
-
-
9,473
TOTAL RSF
561,043
NET STABLE FUNDING RATIO (%)
110.41%
(In EURm)
30.06.2021
Unweighted value by residual maturity
Weighted
value
No maturity
< 6 months
6 months
to < 1yr
≥ 1yr
Available stable funding (ASF) Items
Capital items and instruments
62,759
1,262
-
13,991
76,749
Own funds
62,759
1,262
-
13,991
76,749
Other capital instruments
-
-
-
-
Retail deposits
222,116
2,184
6,232
214,347
Stable deposits
124,121
783
3,802
122,461
Less stable deposits
97,994
1,401
2,430
91,886
Wholesale funding:
544,738
41,496
184,028
305,487
Operational deposits
67,288
0
3
33,647
Other wholesale funding
477,450
41,496
184,025
271,839
Interdependent liabilities
17,461
2
2,570
-
Other liabilities:
35,887
80,198
115
519
577
NSFR derivative liabilities
35,887
All other liabilities and capital instruments
not included in the above categories80,198
115
519
577
TOTAL AVAILABLE STABLE FUNDING (ASF)
597,160
Required stable funding (RSF) Items
Total high-quality liquid assets (HQLA)
42,733
Assets encumbered for more than 12m in cover pool
199
175
45,682
39,148
Deposits held at other financial institutions for operational purposes
-
-
-
-
Performing loans and securities:
255,922
53,529
348,920
380,885
Performing securities financing transactions with financial customerscollateralised by Level 1 HQLA subject to 0% haircut
96,873
8,695
2,371
10,508
Performing securities financing transactions with financial customer collateralised by other assets and loans and advances to financial institutions
60,510
6,891
20,370
29,849
Performing loans to non- financial corporate clients, loans to retail and small business customers, and loans to sovereigns,
and PSEs, of which:73,214
29,092
199,756
233,359
With a risk weight of less than or equal to 35% under the Basel II Standardised Approach for credit risk
13,140
3,522
34,253
43,490
Performing residential mortgages, of which:
4,284
5,315
80,948
59,697
With a risk weight of less than or equal to 35% under the Basel II Standardised Approach for credit risk
3,723
4,782
69,545
49,457
Other loans and securities that are not in default and do not qualify as HQLA, including exchange-traded equities and trade finance on-balance sheet products
21,042
3,535
45,475
47,473
Interdependent assets
17,345
2
2,570
-
Other assets:
-
136,011
613
55,846
83,577
Physical traded commodities
-
-
Assets posted as initial margin for derivative contracts
and contributions to default funds of CCPs25,087
-
-
21,324
NSFR derivative assets
-
-
NSFR derivative liabilities before deduction of variation margin posted
85,716
4,286
All other assets not included in the above categories
25,208
613
55,846
57,967
Off-balance sheet items
177,932
-
-
8,897
TOTAL RSF
555,238
NET STABLE FUNDING RATIO (%)
107.55%
-
12.7 BALANCE SHEET SCHEDULE
The main lines of the Group’s financial liabilities and assets are presented in Note 3.13 to the consolidated financial statements.
(In EURm)
31.12.2021
Note to the
consolidated
financial
statements0-3 m
3 m-1 yr
1-5 yrs
>5 yrs
Total
Due to central banks
5,152
-
-
-
5,152
Financial liabilities at fair value through profit or loss, excluding derivatives
136,581
17,693
23,438
23,244
200,956
Due to banks
Note 3.6
57,174
4,185
76,106
1,712
139,177
Customer deposits
Note 3.6
470,890
15,244
16,568
6,431
509,133
Securitised debt payables
Note 3.6
89,671
12,164
19,040
14,449
135,324
Subordinated debt
Note 3.9
7,735
61
3,649
4,514
15,959
NB: The scheduling assumptions for these liabilities are presented in Note 3.13 to the consolidated financial statements. In particular, the data are shown without provisional interest and excluding derivatives.
(In EURm)
31.12.2020
Note to the
consolidated
financial
statements0-3 m
3 m-1 yr
1-5 yrs
>5 yrs
Total
Due to central banks
1,489
-
-
-
1,489
Financial liabilities at fair value through profit or loss, excluding derivatives
164,209
17,529
20,520
28,813
231,071
Due to banks
Note 3.6
57,383
9,140
67,830
1,218
135,571
Customer deposits
Note 3.6
422,319
14,489
13,328
5,923
456,059
Securitised debt payables
Note 3.6
36,665
34,317
44,998
22,977
138,957
Subordinated debt
Note 3.9
7
2
6,029
9,394
15,432
NB: The scheduling assumptions for these liabilities are presented in Note 3.13 to the consolidated financial statements. In particular, the data are shown without provisional interest and excluding derivatives.
(In EURm)
31.12.2021
Note to the
consolidated
financial
statements0-3 m
3 m-1 yr
1-5 yrs
>5 yrs
Total
Cash, due from central banks
176,064
822
1,988
1,095
179,969
Financial assets at fair value through profit or loss, excluding derivatives
Note 3.4
233,186
9,173
-
-
242,359
Financial assets at fair value through other comprehensive income
Note 3.4
42,798
380
-
272
43,450
Securities at amortised cost
Note 3.5
16,686
289
1,480
916
19,371
Due from banks at amortised cost
Note 3.5
47,182
3,619
4,715
456
55,972
Customer loans at amortised cost
Note 3.5
94,978
65,686
189,325
117,555
467,544
Lease financing agreements(1)
Note 3.5
2,778
6,378
16,024
4,440
29,620
(1)Amounts are featured net of impairments.
(In EURm)
31.12.2020
Note to the
consolidated
financial
statements0-3 m
3 m-1 yr
1-5 yrs
>5 yrs
Total
Cash, due from central banks
164,724
900
1,611
944
168,179
Financial assets at fair value through profit or loss, excluding derivatives
Note 3.4
240,288
9,371
-
-
249,659
Financial assets at fair value through other comprehensive income
Note 3.4
51,090
708
-
262
52,060
Securities at amortised cost
Note 3.5
13,941
146
1,337
211
15,635
Due from banks at amortised cost
Note 3.5
46,790
1,664
4,071
855
53,380
Customer loans at amortised cost
Note 3.5
70,518
75,862
163,365
109,820
419,565
Lease financing agreements(1)
Note 3.5
2,582
6,036
16,167
4,411
29,196
(1)Amounts are featured net of impairments.
Due to the nature of its activities, Société Générale holds derivative products and securities whose residual contractual maturities are not representative of its activities or risks.
By convention, the following residual maturities were used for the classification of financial assets:
1.assets measured at fair value through profit or loss, excluding derivatives (customer-related trading assets):
-positions measured using prices quoted on active markets (L1 accounting classification): maturity of less than 3 months,
-positions measured using observable data other than quoted prices (L2 accountBing classification): maturity of less than 3 months,
-available-for-sale assets measured using prices quoted on active markets: maturity of less than 3 months,
-bonds measured using observable data other than quoted prices (L2): maturity of 3 months to 1 year,
As regards the other lines of the balance sheet, other assets and liabilities and their associated conventions can be broken down as follows:
(In EURm)
31.12.2021
Note to the
consolidated
financial
statementsNot
scheduled0-3 m
3 m-1 yr
1-5 yrs
> 5 yrs
Total
Tax liabilities
Note 6.3
-
-
836
741
-
1,577
Revaluation difference on portfolios hedged against interest rate risk
2,832
-
-
-
-
2,832
Other liabilities
Note 4.4
-
98,035
2,241
3,023
3,006
106,305
Non-current liabilities held for sale
1
-
-
-
-
1
Insurance contracts related liabilities
Note 4.3
-
15,566
10,232
40,848
88,642
155,288
Provisions
Note 8.3
4,850
-
-
-
-
4,850
Shareholders’ equity
70,863
-
-
-
-
70,863
(In EURm)
31.12.2020
Note to the
consolidated
financial
statementsNot
scheduled0-3 m
3 m-1 yr
1-5 yrs
> 5 yrs
Total
Tax liabilities
Note 6.3
-
-
815
-
408
1,223
Revaluation difference on portfolios hedged against interest rate risk
7,696
-
-
-
-
7,696
Other liabilities
Note 4.4
-
76,148
2,218
4,549
2,022
84,937
Non-current liabilities held for sale
-
-
-
-
-
-
Insurance contracts related liabilities
Note 4.3
-
16,593
9,475
38,011
82,047
146,126
Provisions
Note 8.3
4,775
-
-
-
-
4,775
Shareholders’ equity(1)
67,012
-
-
-
-
67,012
(1)Amount as at 31 December 2020 modified in accordance with the restatement of comparative accounting data which can be found in the Group’s financial statements published on 10 February 2022, as well as in Chapter 6 of the 2022 Universal Registration Document.
(In EURm)
31.12.2021
Note to the
consolidated
financial
statementsNot
scheduled0-3 m
3 m-1 yr
1-5 yrs
> 5 yrs
Total
Revaluation differences on portfolios hedged against interest rate risk
131
-
-
-
-
131
Other assets
Note 4.4
-
92,898
-
-
-
92,898
Tax assets
Note 6
4,812
-
-
-
-
4,812
Investments accounted for using
the equity method-
-
-
-
95
95
Tangible and intangible fixed assets
Note 8.4
-
-
-
-
31,968
31,968
Goodwill
Note 2.2
-
-
-
-
3,741
3,741
Non-current assets held for sale
-
1
2
12
12
27
Investments of insurance companies
-
49,908
5,632
36,781
86,577
178,898
(In EURm)
31.12.2020
Note to the
consolidated
financial
statementsNot
scheduled0-3 m
3 m-1 yr
1-5 yrs
> 5 yrs
Total
Revaluation differences on portfolios hedged against interest rate risk
378
-
-
-
-
378
Other assets
Note 4.4
-
67,341
-
-
-
67,341
Tax assets
Note 6
5,001
-
-
-
-
5,001
Investments accounted for using
the equity method-
-
-
-
100
100
Tangible and intangible fixed assets
Note 8.4
-
-
-
-
30,088
30,088
Goodwill
Note 2.2
-
-
-
-
4,044
4,044
Non-current assets held for sale
-
1
1
2
2
6
Investments of insurance companies
-
44,087
7,569
34,097
81,101
166,854
1.Revaluation differences on portfolios hedged against interest rate risk are not scheduled, as they comprise transactions backed by the portfolios in question. Similarly, the schedule of tax assets whose schedule would result in the early disclosure of income flows is not made public.
2.Other assets and other liabilities (guarantee deposits and settlement accounts, miscellaneous receivables) are considered as current assets and liabilities.
3.The notional maturities of commitments in derivative instruments are presented in Note 3.13 to the consolidated financial statements.
-
13 COMPLIANCE RISK, LITIGATION
Compliance means acting in accordance with the obligations applicable to the Group’s activities, ranging from laws and regulations to professional, ethical and internal standards and principles.
By ensuring that these provisions are observed, the Group works to protect its employees, customers and all stakeholders. Compliance with rules is the responsibility of all Group employees, who must demonstrate compliance and integrity in their daily tasks.
The Group relies on a recently restructured, clear organisation to ensure the compliance system is both respected and consistent.
Acting in compliance means understanding and observing the external and internal rules that govern our banking and financial activities. These rules aim to ensure a transparent and balanced relationship between the Bank and all of its stakeholders. Compliance is the cornerstone of trust between the Bank, its customers, its supervisors and its staff.
Compliance with rules is the responsibility of all Group employees, who must demonstrate compliance and integrity on a daily basis. The rules must be clearly expressed, and staff have been informed and/or trained to understand them properly.
The compliance risk prevention system is based on shared responsibility between the operational entities and the Group Compliance Division:
■the operational entities (BU/SUs) must incorporate into their daily activities compliance with laws and regulations, the rules of professional best practice and the Group’s internal rules;
■the Compliance Division manages the Group’s compliance risk prevention system. It ensures the system’s consistency and efficiency, while also developing appropriate relationships – alongside the Corporate Secretariat – with bank supervisors and regulators. This independent division reports directly to General Management.
■Standards and Consolidation teams responsible for defining the normative system and oversight guidelines, consolidating them at Group level, as well as defining the target operational model for each compliance risk;
■Division/business compliance teams who are aligned across the Group’s major business lines (Corporate and Investment Bank, French Retail Banking, International Retail Banking, Private Banking and Corporate Divisions), responsible for the relationship with BU/SUs, including dealflow, advisory, and risk oversight of BU/SUs;
■financial security: Know Your Customer (KYC) processes; the observance of international sanctions and embargo rules, and anti-money laundering and counter-terrorism financing rules, including issuing declarations of suspicion to the relevant authorities where applicable;
■regulatory risks: these cover mainly customer protection, market integrity, anti-bribery and corruption, ethics and conduct, compliance with tax transparency regulations (based on knowledge of the customers’ tax profile), compliance with corporate social responsibility regulations and Group commitments;
Compliance has set up an extensive compulsory training programme for each of these risk categories, designed to raise awareness of compliance risks among all or some employees. The training has been completed by high-level employees within the Group.
-
13.1 COMPLIANCE
In 2018, the Group launched a programme to rework its KYC functions in order to boost their operational efficiency (via the simplification of standards, greater pooling of resources, optimisation of tools and processes) and to improve the customer experience. Placed under the responsibility of the Compliance Division, this programme is closely and regularly monitored at the highest Bank level. Work carried out in this regard has made it possible to redefine a standardised normative framework country by country in terms of KYC due diligence, to develop new customer rating models, and to launch an industrialised system for the screening and processing of negative customer news. This allowed for the upgrading of the anti-corruption system in line with the expectations of the French anti-bribery agency. The Transformation programme will be fully implemented by the end of 2022.
The Group has transposed all the measures linked to the Fifth Directive on anti-money laundering and counter-terrorism financing, as well as European Regulation 2015/847 on the quality of payment information and the Order of 6 January 2021 on the system and internal controls to fight money laundering and terrorism financing.
The system for the detection of suspicious or unusual transactions continued to be strengthened in 2021 with the roll-out of more sophisticated monitoring tools, the optimisation of scenarios used and the launch of initiatives to switch to new-generation monitoring tools, with priority given to International Retail Banking and Boursorama.
In 2021, the international environment was impacted by the reinforcement of US sanctions on China, with greater complexity in terms of implementation that may generate substantial operational risks for financial institutions. More broadly, Societe Generale Group has confirmed its position to abstain from any trading activity with Iran and to maintain transactions with Russia within a strict framework.
The Group continued to strengthen its Embargoes/Sanctions system under the established remedial programme following agreements entered into with the US authorities (see page 258 of the 2022 Universal Registration Document), notably in terms of screening third parties and transactions, training employees and industrialising all processes involved in controlling this risk.
Customer protection is a major challenge for the Societe Generale Group, which is committed to respecting and protecting the interests of its customers.
The prevention of financial vulnerability (early detection), banking inclusion (the right to hold an account) and the replacement or removal of insurance taken out on a real estate loan were priorities in 2021.
Information provided to customers was strengthened with new rules on ESG (Environmental and Social Governance) labelling and designations.
The system keeping track of obligations laid down in European consumer protection regulations (MIF2 and the Insurance Directive or DDA) is in place for product governance and advisory, as well as to ensure compliance with information requirements.
In an environment still dominated by the health and social crisis, significant measures are being implemented in the Group’s system in terms of:
■strengthening internal rules regarding key aspects of customer protection (marketing rules, cross-border sales, customer claims, conflicts of interest, product governance, protection of customers’ assets, along with compensation and qualification of employees);
■specific training and increased staff awareness; the importance the Group places on this issue is largely addressed in the Group’s Code of Conduct;
■adapting as a matter of necessity existing tools to new regulatory requirements, in particular the Shareholder Rights Directive II (SRD2), applicable as of 2021.
Processing a claim is a commercial act that impacts customer satisfaction. Accordingly, it has received much coverage in the Code of Conduct.
The “Customer claim processing” Group instruction incorporates the recommendations of the national supervisor (French Prudential Supervisory and Resolution Authority – ACPR) and the regulatory requirements (MIF2, DDA and DSP – the Payment Services Directive) relative to the strengthening of customer protection measures at European level. The bank’s businesses have an ad hoc governance, an organisation, human resources and applications, formalised procedures, and quantitative and qualitative monitoring indicators.
Mediation independent from the Bank supplements this internal system. Mediation, a measure aimed at amicable settlement, is brought to customers’ awareness on multiple information media, in particular through a permanent notice on the back of bank account statements. Every entity involved is obliged to comply with the independent mediator’s decision.
The Group has a clear normative framework in place to prevent and manage conflicts of interest. This framework specifies the principles and mechanisms that have been implemented. This robust system covers three categories of potential conflicts of interest: those that may arise between the Group and its customers or between the Group’s customers; those occurring between the Group and its employees (particularly in relation to activities involving an employee’s personal interest and/or their professional obligations); and, lastly, those arising between the Group and its suppliers. The system has been supplemented by the reporting of conflicts of interest (Déclaration des Conflits d’intérêts – DACI) required of Group employees most exposed to the risks of corruption.
Systematic reviews ahead of and during the marketing process ensure compliance with product governance obligations. As product originator, Societe Generale sets up Product Review Committees to ensure the target market has been defined correctly and, if not, to adjust it accordingly. As distributor, Societe Generale checks that the criteria match the customers’ situation and communicates with product originators to track products during their life cycle. Updated in 2021, Societe Generale’s investment services policy now includes new offers in terms of sustainable finance, the supervision of crypto-assets, and detailed notes on the target markets of the main instruments produced or distributed by each business.
Societe Generale has established practices and usages to comply with legislation vis-à-vis vulnerable customers, in particular customers benefiting from the offer tailored to financially vulnerable customers. To contribute to the national effort to boost the purchasing power of French citizens in challenging financial circumstances, the Group has added to its practices by introducing additional measures in 2019, notably: i) freezing bank fees; ii) capping bank intervention fees for vulnerable clients; and iii) organising follow-up and support suited to the situation of customers experiencing difficulties in the wake of recent events. These measures are closely monitored and covered in action plans aimed at identifying financially vulnerable customers.
■regulations for transparency and to reduce the systemic risk inherent in over-the-counter (“OTC”) derivatives;
■separation of proprietary trading by banks (US Volcker Rule and French Banking Law on the Separation and Regulation of Banking Activities).
The overall system for hedging Market Integrity risk was strengthened in 2021, in particular with respect to processes and controls on OTC derivatives activities in accordance with the relevant regulations, and on preventive measures concerning personal staff transactions.
The system continued to be strengthened in 2021 with the extension and improvement of tools identifying market manipulation risks and an extensive employee training programme on the subject.
Regarding staff transactions, Societe Generale implemented a new pre-authorisation tool based on classifying employees in terms of their exposure to confidential information on investment services customers or on the Bank as issuer.
Regarding market indices: the Group has implemented an action plan to monitor contributions to benchmarks and ensure their Group-wide administration. In addition to contributions to benchmark indices and the administration of indices, the use of indices has been subject to regulatory restrictions since January 2020. This system is monitored Group-wide.
The year was also characterised by the Group’s preparation for the IBOR transition in order to replace IBOR interest rate benchmarks with alternative, risk-free rates.
The US Volcker Rule – which established a prohibition in principle for certain institutions in the financial services sector, such as the Societe Generale Group, to conduct speculative trading and hold covered funds(1) on its own account – was subject to two major amendments in 2019 and 2020. These amendments ease the Societe Generale Group’s regulatory obligations.
The system overseeing compliance with the Volcker Rule and the Separation and Regulation of Banking Activities Act has been made permanent and stabilised following the aforementioned developments in 2020. Moreover, the system providing a regulatory framework for market activities (regarding activity indicators, in particular) was reformed in March 2019 (Order of 18 March 2019). These changes were incorporated into the internal normative and control system.
Regulatory risks related to derivatives market activities are covered by European regulations (MIFIR, EMIR regulation) and US regulations (Dodd-Frank Act).
These regulations remain subject to changes. Combined with business and technological developments, they require constant updates and adjustments to the compliance management system. The year 2021 was characterised by the continued implementation of new requirements.
In light of the many regulatory requirements attached to transaction reporting, and regulators’ heightened interest in the quality of such reports, Societe Generale is continuing to deploy a new Group policy dedicated to mandatory compliance reporting (including transaction reporting). This policy defines the governance and control standards applicable to these reports.
Societe Generale Group’s principles on combating tax evasion are governed by the Tax Code of Conduct. The Code was updated in March 2017 and approved by the Board of Directors after review by the Executive Committee. It is a public document and can be consulted on the Bank’s institutional investor portal (https://www.societegenerale.com/sites/default/files/documents/Code%20de%20conduite/tax_code_of_conduct_of_societe_generale_group_uk.pdf).
■Societe Generale ensures compliance with the tax rules applicable to its business in all countries where the Group operates, in accordance with international conventions and national laws;
■in its customer relationships, Societe Generale ensures that customers are informed of their tax obligations relating to transactions carried out with the Group, and the Group complies with the reporting obligations that apply to it as bookkeeper or in any other way;
■in its relations with the tax authorities, Societe Generale is committed to strictly respecting tax procedures and ensures that it maintains open and transparent relations to maintain its reputation;
(1)The Volcker Rule does not offer a specific definition of the term “covered fund”. It sets out a general prohibition to deal with hedge funds and private equity funds, also including a list of exceptions based on the products and/or strategy of the fund, which may provide an exemption from this category. For example, retirement or pension funds, foreign public funds, acquisition vehicles and securitisation vehicles are not considered covered funds.
■Societe Generale does not encourage or promote tax evasion for itself, its subsidiaries or its customers;
■Societe Generale has a tax policy in line with its strategy of sustainable profitability and refrains from any operation, whether for its own account or for its customers, whose main purpose or effect is tax motivated, unless this is consistent with the intention of the legislation.
The Board of Directors annually reviews the application of the Code and the procedures and systems in place within the Group to ensure that new products and new establishments comply with the Group’s tax principles.
Relationships with legislators and tax law policy makers are governed by the Charter for Responsible Advocacy with respect to Public Authorities and Representative Institutions (https://www.societegenerale.com/sites/default/files/documents/Document%20RSE/societe-generale-obligations-for-a-responsible-advocacy.pdf).
The Group is committed to a strict policy with regard to tax havens. No Group entity is authorised in a state or territory on the official French list of ETNCs (États et territoires non coopératifs in French)(1) and internal rules have been in place since 2003 to monitor an expanded list of countries or territories.
The Group follows the Organization for Economic Co-operation and Development’s (OECD) transfer pricing standards. However, local constraints may require deviations from OECD methodologies, in which case the local constraints must be documented.
The Group publishes information on its entities and activities annually on a country-by-country basis (Section 2 – 2.12 – page 58 of the 2022 Universal Registration Document) and confirms that its presence in a number of countries is for commercial purposes only, and not to benefit from special tax provisions. The Group also complies with the tax transparency rules for its own account (CbCR – country-by-Country Reporting).
The Group is fully committed to implementing regulations aimed at ensuring tax transparency for its customers’ accounts (in particular FATCA and the Common Reporting Standard – CRS, DAC6).
Some of the tax regulations define tax transparency requirements. FATCA (Foreign Account Tax Compliance Act), CRS (Common Reporting Standard), QI (Qualified Intermediary) and DAC6 (Directive on Administrative Cooperation 6) regulations have the common goal of combating fraud and tax evasion by customers. The risks borne by financial institutions are financial, commercial and reputational in nature. The Group’s main challenges involve adapting to regulatory developments, which are becoming increasingly stringent over the years, and strengthening its control systems.
Societe Generale complies with tax transparency standards. The Common Reporting Standard (CRS) enables tax authorities to be systematically informed of income received abroad by their tax residents, including where the accounts are held in asset management structures. Moreover, Societe Generale complies with the requirements of the United States FATCA (Foreign Account Tax Compliance Act), which aims to combat tax evasion involving foreign accounts or entities held by US taxpayers. Non-US financial intermediaries are thus responsible for identifying US taxpayers in their customer base in order to declare the income received by said taxpayers, directly or indirectly, to the US tax administration, thereby enabling an automatic reconciliation with their individual tax returns. The tax transparency objectives have been achieved by generating a tax report filed at national level and sharing tax information between partner countries on the basis of existing bilateral tax treaties and inter-governmental agreements (IGAs).
Lastly, the Group has implemented the new European Directive on transparency between intermediaries (referred to as DAC6), which will require the reporting of cross-border tax arrangements. The Group Compliance Division has supported the Group Tax Department in implementing DAC6, more specifically the D regulatory marker regarding schemes aimed at circumventing the CRS and those involving opaque chains of beneficial owners.
Importantly, the account-keeping entities of the Private Banking business line are established exclusively in countries with the strictest tax transparency rules imposed by G20 member countries and the OECD. These countries ratified the Convention on Mutual Administrative Assistance in Tax Matters, introduced the automatic exchange of information in financial accounts (CRS) and obtained the “largely compliant” and “compliant” rating as part of the peer review process conducted under the aegis of the OECD. Assets deposited in Private Banking books are subject to enhanced scrutiny using comprehensive due diligence procedures to ensure they are tax compliant.
In accordance with regulatory requirements, Societe Generale also includes tax fraud in its anti-money laundering procedures.
Societe Generale is fully committed to fighting corruption and has given clear undertakings in this respect by participating in the Wolfsberg Group and the Global Compact.
The Group applies strict principles that are included in its Code of Conduct and its “Anti-Corruption and Influence Peddling Code”.
Within this context, processes and tools continue to be strengthened with the provision of staff dedicated to anti-corruption practices within the Group, and the creation of monitoring indicators and new controls – including accounting and operational controls to reduce the risk of corruption.
The Group’s anti-corruption instructions have been revised and expanded to include a new version of the Anti-Corruption and Influence Peddling Code, which was incorporated into the Internal Rules in April 2021.
The Societe Generale Group now has several tools at its disposal, such as the tool for declaring gifts and invitations (GEMS), the tool for whistleblowing management (WhistleB), and the annual conflict of interest declaration tool (DACI).
Training measures have been strengthened, in particular with respect to persons most exposed to the risk of corruption, accounting controllers, and members of General Management and the Board of Directors.
Third-party knowledge procedures have been improved, with special focus on intermediaries, as well as the introduction of due diligence for suppliers and associations benefiting from donations or sponsorship initiatives.
European financial regulations have seen significant changes from a social and environmental perspective, in particular with the entry into force in March 2021 of Regulation (EU) 2019/2088 – SFDR on sustainability-related disclosures in the financial services sector, and the Taxonomy Regulation (EU) 2020/852 on the establishment of a framework to facilitate sustainable investment. The Compliance Division is developing the normative framework relative to the European Union regulations on sustainable investment. A dedicated programme is helping the business lines to comply with regulations and is producing deliverables pertaining to normative documentation, training, controls and supervision.
Over and above the regulations, the Group is making voluntary, public commitments in this area. To manage the implementation of the environmental and social risk management system and ensure the Group’s commitments are upheld, the Compliance Division has taken the following measures:
■deploying e-learning on environmental and social risk management. The training was made compulsory for all employees having a direct or indirect relationship with corporate customers. Moreover, specific workshops were conducted with targeted employees in the Compliance Division to foster an understanding of and compliance with the criteria for applying voluntary commitments;
■defining an environmental and social escalation procedure with respect to corporate customers to set out the criteria requiring business lines to reach out to the Compliance Division and, where applicable, the Responsible Commitments Committee, to connect with a company or during situations likely to present a reputational risk arising from environmental or social factors.
As a trusted partner of its customers, Societe Generale is especially sensitive to personal data protection.
Following the entry into force of the General Data Protection Regulation (GDPR), which increases the Company’s obligations and the level of sanctions in case of non-compliance with these obligations (up to 4% of revenue), the Societe Generale Group has considerably strengthened its personal data processing management system.
Across all Group entities, internal instructions and associated procedures in line with local and European regulations define the rules to apply and the measures to take to guarantee the protection and security of customer and staff data. In particular, measures to inform data subjects (customers, employees, shareholders, suppliers, etc.) and process their demands are in place so that such persons can exercise their rights, notably via dedicated digital platforms. A personal data security policy has been defined, which fits in with the Group’s overall security strategy, especially as regards cybersecurity. Moreover, there has been a specific effort to increase staff awareness via dedicated training.
Lastly, Societe Generale Group has appointed a Data Protection Officer (DPO) who reports to the Head of Group Compliance and is the main contact person for the Personal Data Protection Authority (Commission Nationale de l’Informatique et des Libertés – CNIL). The DPO is responsible for ensuring sound Group compliance for personal data protection. Alongside the network of local DPOs and correspondents throughout the Group entities, the DPO assists them with security issues and personal data usage. As part of his or her duties, the DPO regularly reviews a number of indicators, notably the number and nature of requests by persons seeking to exercise their rights under GDPR, the internal training completion rate, and the local DPO certification programme.
In keeping with the regulatory framework defined by European Directive CRD4, Societe Generale has had a specific governance in place to determine variable compensation since the end of 2010. The rules introduced by this directive apply not only to financial market professionals, but to all persons whose activity is likely to have a substantial impact on the risk profile of the institutions which employ them, including those exercising control functions.
The regulatory framework defined by European Directive CRD4 since 2014 and by European Directive CRD5 which has applied since 1 January 2021 does not modify the rules determining the variable compensation of persons whose activity is likely to have an impact on the risk profile of the Group and of the employees who exercise control functions. The above-mentioned principles and governance remain in place within the Group.
According to the principles approved by the Board of Directors as proposed by the Compensation Committee, the compensation mechanisms and processes for the identified population not only factor in the financial results of the transactions undertaken, but also the broader context and how these results are generated, especially in terms of control and management of all risks and adherence to compliance rules. Control function employees are compensated independently of the results of the transactions that they control, and according to criteria specific to their activity.
Variable compensation includes a non-deferred portion and a deferred portion. The acquisition of the deferred portion of the variable compensation is subject to three conditions: a minimum length of service, a minimum level of financial performance of the Company and/or the activity, and appropriate management of risks and compliance (malus and clawback provisions). All deferred variables of the regulated population are subject to a non-payment clause to sanction any excessive risk-taking or behaviour deemed unacceptable. Subject to applicable regulations, a clawback clause enables Societe Generale to request the return of deferred variables, in part or in full, after the holding period and for a five-year period after their allocation was included in the Group’s plan for deferred variable compensation allocated for 2021.
At least 50% of this compensation is paid in shares or equivalent securities. The purpose of these payment methods is to align the compensation with the Company’s performance and risk horizon.
The Risk Division and Compliance Division help define and implement this policy. In particular, every year they independently assess the main activities of Wholesale Banking, and of French and International Retail Banking, and the principal risk takers, together with the desk managers subject to the Separation and Regulation of Banking Activities Act and the Volcker Rule in relation to their risk management and compliance. These assessments are reviewed by General Management and taken into account when determining the amounts of variable compensation.
Furthermore, Societe Generale has implemented a specific system and governance aimed at the holders of trading mandates to ensure that the compensation policy genuinely factors in the requirements of the Separation and Regulation of Banking Activities Act of 26 July 2013 and the Volcker Rule.
In keeping with our historical approach and in accordance with the recommendations of the Committee of European Banking Supervisors, several regulatory principles – the portion of deferred compensation, the acquisition of which is subject to conditions of presence, the minimum performance of the Group and the activity, and appropriate risk and compliance management – apply to a wider population than the regulated population depending on the level of variable compensation, notably across the scope of Wholesale Banking.
In addition, the Group’s annual employee appraisal tool has included a Conduct and Compliance section since 2018, enabling managers to factor in cases of non-compliant employee behaviour with respect to risk management, quality of service and respecting customers’ interests. Where an employee has failed to observe conduct and compliance rules, the manager must draft and implement a dedicated action plan to assist him or her. The results of this specific appraisal measure are crucial in determining the employee’s career path and compensation.
The consideration given to risks in the compensation policy is presented every year to the Risks Committee and a Director sitting on the Risks Committee also sits on the Compensation Committee.
■supports the Compliance Control Officers of the businesses in their strategy for preventing, identifying, assessing and controlling reputational risk;
■develops a reputational risk dashboard that is communicated quarterly to the Risk Committee of the Board of Directors, based on information from the businesses/Business Units and support functions/Service Units (in particular the Human Resources, Communications, Legal, Corporate Social Responsibility and Data Protection Departments).
Moreover, Chief Compliance Officers dedicated to Business Units take part in the various bodies (new product Committees, ad hoc Committees, etc.) organised to approve new types of transactions, products, projects or customers, and formulate a written opinion as to their assessment of the level of risk of the planned initiative, and notably the reputational risk.
In June 2018, Societe Generale entered into agreements with the US Department of Justice (DOJ) and the US Commodity Futures Trading Commission (CFTC) to resolve their investigations into IBOR submissions, and with the DOJ and the French Parquet National Financier (PNF) to resolve their investigations into certain transactions involving Libyan counterparties.
In November 2018, Societe Generale entered into agreements with the US authorities to resolve their investigations into certain US dollar transactions involving countries, persons or entities subject to US economic sanctions.
As part of these agreements, the Bank has committed to enhance its compliance system in order to prevent and detect any violation of anti-corruption and bribery, market manipulation and US economic sanction regulations, and any violation of New York state laws. The Bank has also committed to enhance corporate oversight of its economic sanctions compliance programme.
Moreover, the Bank has agreed with the US Federal Reserve to hire an independent consultant to assess the Bank’s progress on the implementation of measures to strengthen its compliance programme with respect to sanctions and embargoes.
To meet the commitments made by Societe Generale as part of these agreements, the Bank has developed a programme to implement these commitments and strengthen its compliance system in the relevant areas. This programme has been placed under the direct supervision of the Group Head of Compliance. In addition, the programme’s Steering Committee is chaired by a member of the Bank’s General Management, and a programme progress report is presented to the Board of Directors on a monthly basis.
In 2021, the Programme was rolled out according to the schedule presented to the internal Governance bodies and the various authorities who have received regular reports on the progress of remedial actions. Moreover, the external audits provided in the agreements have been conducted or are under way.
On 30 November and 2 December 2021, the US federal court confirmed the termination of legal proceedings by the DOJ, which confirmed that Societe Generale complied with obligations relating to the DPA (deferred prosecution agreements) of June and November 2018. In December 2020, the French Parquet National Financier (PNF) resolved proceedings against Societe Generale and acknowledged that Societe Generale fulfilled its obligations with respect to the public interest judicial convention.
On 19 November 2018, Societe Generale Group and its New York branch (SGNY) entered into an agreement (enforcement action) with the NY State Department of Financial Services regarding the SGNY anti-money laundering compliance programme. This agreement requires (i) submitting an enhanced anti-money laundering programme, (ii) an anti-money laundering governance plan, and (iii) the performance of an external audit in 2020.
As background information, on 14 December 2017, Societe Generale and SGNY on the one hand, and the Board of Governors of the Federal Reserve on the other hand, agreed to a Cease and Desist order (the “Order”) regarding the SGNY compliance programme to adhere to the Bank Secrecy Act (“BSA”) and its anti-money laundering (“AML”) obligations (the “Anti-Money Laundering Compliance Program”), and regarding some aspects of its Know Your Customer (KYC) programme.
This Cease and Desist Order signed on 14 December 2017 with the US Federal Reserve supersedes the Written Agreement entered into in 2009 between Societe Generale Group and SGNY on the one hand, and the US Federal Reserve and the New York State Financial Services Department on the other hand.
On 17 December 2019, Societe Generale SA and SGNY signed an agreement with the Federal Reserve Bank of New York (FRB) regarding compliance risk management. This agreement includes the submission and approval by the FRB, followed by the implementation, of (i) an action plan to strengthen supervision by the US Risk Committee of the compliance risk management programme, (ii) an action plan to improve the compliance risk management programme in the US, and (iii) revisions of the internal audit programme concerning compliance risk management audits in the US. As at the end of 2021, these actions were being implemented.
-
14.1 MODEL RISK MONITORING
The Group is fully committed to maintaining a solid governance system in terms of model risk management in order to ensure the efficiency and reliability of the identification, design, implementation, modification monitoring processes, independent review and approval of the models used. An MRM (“Model Risk Management”) Department in charge of controlling model risk was created within the Risk Department in 2017. Since then, the model risk management framework has been consolidated and structured and is based today on the following device.
The model risk management system is implemented by the three independent lines of defence, which correspond to the responsibility of the business lines in risk management, to the review and independent supervision and evaluation of the system and which are segregated and independent to avoid any conflict of interest.
■the first line of defence (LoD1), which brings together several teams with diverse skills within the Group, is responsible for the development, implementation, use and monitoring of the relevance over time of the models, in accordance with model risk management system; these teams are housed in the Business Departments or their Support Departments;
■the second line of defence (LoD2) is made up of governance teams and independent model review teams, and supervised by the “Model Risk” Department within the Risk Department;
■the third line of defence (LoD3) is responsible for assessing the overall effectiveness of the model risk management system (the relevance of governance for model risk and the efficiency of the activities of the second line of defence) and the independent audit of models: it is housed within the Internal Audit Department.
A MRM Committee chaired by the Risk Director meets at least every three months to ensure the implementation of the management system and monitor the risk of models at Group level. Within the second line of defence and the “Model risk” Department, a governance team is in charge of the design and management of the model risk management system at Group level.
■the normative framework applicable to all of the Group’s models is defined, applied when necessary to the main families of models to provide details on the specifics, and maintained while ensuring the consistency and homogeneity of the system, its integrity and its compliance with regulatory provisions; this framework specifies in particular the definition of expectations with regard to LoD1, the principles for the model risk assessment methodology and the definition of guiding principles for the independent review and approval of the model;
■the identification, recording and updating of information of all models within the Group (including models under development or recently withdrawn) are carried out in the model inventory according to a defined process and piloted by LoD2;
■the monitoring and reporting system relating to model risk incurred by the Group in Senior Management has been put in place. The appetite for model risk, corresponding to the level of model risk that the Group is ready to assume in the context of achieving its strategic objectives, is also formalized through statements relating to risk tolerance, translated under form of specific indicators associated with warning limits and thresholds.
For each model, risk management is based on compliance with the rules and standards defined for the entire Group by each LoD1 player, it is guaranteed by an effective challenge from LoD2 and a uniform approval process.
The need to examine a model is assessed according to the level of model risk, its model family and applicable regulatory requirements. The independent review by the second line of defence is triggered in particular for new models, periodic model reviews, proposals to change models and transversal reviews in response to a recommendation:
■it corresponds to all the processes and activities which aim to verify the conformity of the functioning and use of the models with respect to the objectives for which they were designed and to the applicable regulations, on the basis of the activities and controls implemented by LoD1;
■it is based on certain principles aimed at verifying the theoretical robustness (evaluation of the quality of the design and development of the model), the conformity of the implementation and use, and the relevance of the monitoring of the model;
■it gives rise to an independent Review Report, which describes the scope of the review, the tests carried out, the results of the review, the conclusions or the recommendations.
The approval process follows the same approval scheme for all models, the composition of governance bodies being able to vary according to the level of model risk, the family of models, the applicable regulatory requirements and the Business Units/Service Units in which model is applicable. Responsible for LOD2, the approval process consists of two consecutive instances:
■the Review Authority which aims to present the conclusions identified by the review team in the independent Review Report and to discuss, allowing for a contradictory debate between LoD1 and LoD2. Based on the discussions, LoD2 confirms or modifies the conclusions of the review report, including the findings and recommendations, without being limited thereto;
■the Approval Authority, a body which has the power to approve (with or without reservation) or reject the use of a model, changes made to the existing model or continuous monitoring of the relevance of the model along the time proposed by the LOD1, from the independent Review Report and the minutes of the Review Authority.
-
15 RISK RELATED TO INSURANCE ACTIVITIES
Through its insurance subsidiaries, the Group is also exposed to a variety of risks linked to this business. In addition to balance sheet management risks (interest rate, valuation, counterparty and exchange rate risks), these risks include premium pricing risk, mortality risk and the risk of an increase in claims.
Risk related to insurance activities: through its insurance subsidiaries, the Group is also exposed to a variety of risks linked to this business. In addition to balance sheet management risks (interest rate, valuation, counterparty and exchange rate risk), these risks include premium pricing risk, mortality risk and the risk of an increase in claims.
-
15.1 MANAGEMENT OF INSURANCE RISKS
■underwriting risks, particularly risk through life insurance, individual personal protection and non-life insurance. This risk can be biometrical: disability, longevity, mortality, or related to policyholders’ behavior (risk of lapses). To a lesser extent, the Insurance business line is also exposed to non-life and health risks. Such risks can come from pricing, selection, claims management or catastrophic risk;
■risks related to financial markets and ALM: the Insurance business line, mainly through life insurance on the French market, is exposed to instabilities on the financial markets (changes in interest rates and stock market fluctuations) which can be made worse by policyholder behavior.
Managing these risks is key to the Insurance business line’s activity. It is carried out by qualified and experienced teams, with major bespoke IT resources. Risks are monitored and regularly reported, they are framed by risk policies validated by the Board of Directors of each entity.
■heightened security for the risk acceptance process, with the aim of guaranteeing that the price schedule matches the policyholder’s risk profile and the guarantees provided;
■regular monitoring of indicators on product claims rates in order to adjust certain product parameters, such as pricing or the level of guarantee, if necessary;
Management of risks linked to the financial markets and to ALM is an integral part of the investment strategy as long-term performance objectives. The optimization of these two factors is highly influenced by the asset/liability balance. Liability commitments (guarantees offered to customers, maturity of policies), as well as the amounts booked under the major items on the balance sheet (shareholders’ equity, income, provisions, reserves, etc.) are analyzed by the Finance and Risk Department of the Insurance business line.
Risk management related to financial markets (interest rates, credit and shares) and to ALM is based on the following:
■monitoring short- and long-term cash flows (match between the term of a liability and the term of an asset, liquidity risk management);
-
15.2 INSURANCE RISK MODELLING
The models are reviewed by the Insurance Risks Department, which is the second line of defence in the context of model risk management. The review works relate to the theoretical robustness (evaluation of the quality of design and development) of the models, the use of the model, the conformity of the implementation and the continuous monitoring of the relevance of the model over time. The independent review process ends with (i) a report describing the scope of the review, the tests performed, the results of the review, conclusions or recommendations and by (ii) validation Committees. The model control system gives rise to recurring reporting to the appropriate bodies.
-
16.1 EQUITY RISKS
The Group has limited appetite for financial shareholdings in proprietary private equity operations. The types of admissible private equity operations chiefly relate to:
■commercial support for the network through the private equity arm of the Societe Generale and Crédit du Nord networks and those of certain foreign subsidiaries;
Private equity investments are managed directly by the networks concerned (Societe Generale, Crédit du Nord and foreign subsidiaries) and are capped at EUR 25 million. Any investments above this threshold must be approved by the Group Strategy Department based on a file submitted by the Business Unit in conjunction with the Finance Department. The file must include arguments justifying a private equity investment of the allotted size, the projected outcome and the expected profitability based on the consumption of the associated capital, the investment criteria (criteria, typology, duration, etc.), risk analysis and the proposed governance. The Group’s General Management must approve the investment amount if it exceeds EUR 50 million and base its decision on the opinion delivered by the Strategy Department, the Finance Department, the General Secretariat and the Compliance Department. Every six months, the relevant Business Unit must submit a report to the Strategy Department which tracks the operation and the use of the allocated investment amount.
Other private equity minority investments undergo a dedicated validation process for both the investment and divestment phases. They are approved by the Heads of the Business Units and of the entities concerned and by their Finance Department, the Strategy Department and also the Group’s General Management for amounts exceeding EUR 50 million, in addition to the Board of Directors for amounts above EUR 250 million. These files are assessed by the Strategy Department with the assistance of experts from the Services and Business Units involved in the operation, comprising at least the Finance Department, the Corporate Secretariat’s Legal and Tax Departments and the Compliance Department. The assessment is based on a review of the proposed shareholding, the arguments in favour of such an investment and its context, the structuring of the operation, its financial and prudential impacts, the assessment of identified risks and the resources employed to track and manage them.
-
16.2 RESIDUAL VALUE RISK
Through its Specialised Financial Services division, mainly in its long-term vehicle leasing subsidiary, the Group is exposed to residual value risk (where the net resale value of an asset at the end of the leasing contract is less than expected).
Société Générale Group holds, inside its ALDA Business Units (automobile leasing activity) cars on its balance sheet with a risk related to the residual value of these vehicles at the moment of their disposals. This residual value risk is managed by ALD Automotive (ALDA).
The Group is exposed to potential losses in a given reporting period caused by (i) the resale of vehicles associated with leases terminated in the reporting period where the used car resale price is lower than its net book value and (ii) additional depreciation booked during the lease term if the expected residual values of its vehicles decline below the contractual residual value. The future sales results and estimated losses are affected by external factors like macroeconomic, government policies, environmental and tax regulations, consumer preferences, new vehicles pricing, etc.
ALDA gross operating income derived from car sales totalled EUR 437.7 million at 31 December 2021 versus EUR 61.1 million at 31 December 2020.
The residual value setting procedure defines the processes, roles and responsibilities involved in the determination of residual values that will be used by ALDA as a basis for producing vehicle lease quotations.
A Residual Value Review Committee is held at least twice a year within each operating entity of ALDA. This Committee debates and decides residual values, taking into account local market specificities, documenting its approach, ensuring that there is a clear audit trail.
A central ALDA team dedicated to control validates the proposed residual values prior to their being notified to the operating entities and updated in the local quotation system. This team informs ALD’s Group Finance Director and Risk Manager in case of disagreements.
Additionally, the fleet revaluation process determines an additional depreciation in countries where an overall loss on the portfolio is identified. This process is performed locally twice a year for operating entities owning more than 5,000 cars (once a year for smaller entities) under the supervision of the central team and using common tools and methodologies. This depreciation is booked in accordance with accounting standards.
-
16.3 STRATEGIC RISKS
Strategic risks are defined as the risks inherent in the choice of a given business strategy or resulting from the Group’s inability to execute its strategy. They are monitored by the Board of Directors, which approves the Group’s strategic direction and reviews them at least once every year. Moreover, the Board of Directors approves strategic investments and any transaction (particularly disposals and acquisitions) that could significantly affect the Group’s results, the structure of its balance sheet or its risk profile.
Strategic steering is carried out under the authority of the General Management, by the General Management Committee (which meets weekly without exception), by the Group Strategy Committee and by the Strategic oversight Committees of the Business Units and Service Units. The make-up of these various bodies is set out in the Corporate Governance chapter of the Universal Registration Document, chapter 3 (pages 61 and following). The Internal Rules of the Board of Directors (provided in Chapter 7 of the Universal Registration Document, page 617) lay down the procedures for convening meetings.
-
16.5 CONDUCT RISK
The Group is also exposed to conduct risk through all of its core businesses. The Group defines conduct risk as resulting from actions (or inactions) or behaviours of the Bank or its employees, inconsistent with the Group’s Code of Conduct, which may lead to adverse consequences for its stakeholders, or place the Bank’s sustainability or reputation at risk.
Stakeholders include in particular our clients, employees, investors, shareholders, suppliers, the environment, markets and countries in which we operate.
-
17.2 STATEMENT OF THE PERSON RESPONSIBLE FOR THE PILLAR 3 REPORT
I certify, after having taken all reasonable measures to this effect, that the information disclosed in this Pillar 3 Risk Report complies, to the best of my knowledge, with Part 8 of EU Regulation No. 2019/876 (and its subsequent amendments) and has been established in accordance with the internal control procedures agreed upon at the management body level.
-
18.1 PILLAR 3 CROSS-REFERENCE TABLE
CRD4/CRR
article
Theme
Pillar 3 report reference
(except reference to the Universal Registration Document)
Page in
Pillar 3 report
90 (CRD)
Return on assets
5 Capital management and adequacy
56
435 (CRR)
Risk management objectives and policies
1 Group concise risk statement
3 Risk management and organisation
12 Liquidity risk
4-10
30-43
232-234
436 (CRR)
Scope of application
5 Capital management and adequacy
56-59; 83-88
SG website - Capital instruments and TLAC eligible SNP/SP
SG website - Information about the consolidation scope
SG website - Differences in the scopes of consolidation (LI3)
437 (CRR)
Own funds
5 Capital management and adequacy
60-63; 70-73
437a (CRR)
TLAC and related eligible instruments
5 Capital management and adequacy
SG website - Capital instruments and TLAC eligible SNP/SP
66; 74-76
438 (CRR)
Capital requirements
5 Capital management and adequacy
55; 64; 162-164; 179; 214
439 (CRR)
Exposure to counterparty credit risk
7 Counterparty credit risk
166-179
440 (CRR)
Capital buffers
5 Capital management and adequacy
80-82
441 (CRR)
Indicators of global systemic importance
SG website - Information and publication section
442 (CRR)
Credit risk adjustments
6 Credit risk
94; 123-137
443 (CRR)
Encumbered and unencumbered assets
12 Liquidity risk
234-237
444 (CRR)
Information on the use of the standardised approach/use of ECAIs
6 Credit risk
8 Securitisation
95-96; 145-148
192
445 (CRR)
Exposure to market risk
9 Market risk
200-214
446 (CRR)
Operational risk
10 Operational risk
216-224
447 (CRR)
Information on key metrics
1 Group concise risk statement
10-12
448 (CRR)
Exposure to interest rate risk on positions not included in the trading book
11 Structural interest rate and exchange rate risks
226-229
449 (CRR)
Exposure to securitisation positions
8 Securitisation
182-197
450 (CRR)
Remuneration policy
First update of the Pillar 3 report (planned)
451 (CRR)
Leverage
5 Capital management and adequacy
67; 77-80
451a (CRR)
Liquidity
12 Liquidity risk
232-234; 238-246
452 (CRR)
Use of the IRB Approach to credit risk
6 Credit risk
95-114; 149-157
453 (CRR)
Use of credit risk
mitigation techniques6 Credit risk
92-94; 137; 158-162
454 (CRR)
Use of the advanced measurement approaches to operational risk
10 Operational risk
216-224
455 (CRR)
Use of internal market risk models
9 Market risk
200-214
-
18.2 INDEX OF THE TABLES IN THE RISK REPORT
Chapter
Table number
Pillar 3 report
Table number
URD(1)
Title
Page in
Pillar 3 report
Page in the
URD(1)
EBA
regulatory
references
1
1
10
Distribution of RWA by core business and by risk type
5
189
1
2
Provisioning of doubtful loans
7
1
3
Cost of risk
7
1
4
Market risk – VaR and SVaR
8
1
5
35
Sensitivity of the Group’s value to a +10 bps interest rate variation
9
1
6
Key metrics
10
KM1
1
7
TLAC – Key metrics
12
KM2
3
8
1
Financial assets and liabilities and derivatives impacted by the interest rate benchmarks reform
42
172
5
9
2
Difference between accounting scope and prudential reporting scope
56
181
5
10
3
Reconciliation of regulatory own funds to balance sheet in the audited financial statements
57
182
CC2
5
11
4
Entities outside the prudential scope
59
184
5
12
Total amount of debt instruments eligible for Tier 1 equity
61
5
13
5
Changes in debt instruments eligible for solvency capital requirements
61
186
5
14
6
Breakdown of prudential capital requirement for Societe Generale
62
186
5
15
7
Regulatory capital and CRR/CRD4 solvency ratios
62
187
5
16
8
CET1 regulatory deductions and adjustments under CRR/CRD4
63
187
5
17
9
Overview of risk-weighted assets
64
188
OV1
5
18
10
Risk-weighted assets (RWA) by core business and risk type
65
189
5
19
Main subsidiaries’ contributions to the Group’s RWA
65
5
20
11
Leverage ratio summary and transition from prudential balance sheet to leverage exposure
67
190
5
21
Financial conglomerates information on own funds and capital adequacy ratio
68
INS2
5
22
Comparison of own funds and capital and leverage ratios with and without the application of transitional arrangements for IFRS 9
69
IFRS9-FL
5
23
Non-deducted equities in insurance undertakings
69
INS1
5
24
Composition of regulatory own funds
70
CC1
5
25
TLAC – Composition
73
TLAC1
5
26
TLAC – Creditor ranking of the resolution entity
75
TLAC3
5
27
Summary reconciliation of accounting assets and leverage ratio exposures
77
LR1-LRSUM
5
28
Leverage ratio – Common disclosure
78
LR2-LRCOM
5
29
Leverage ratio – Split-up of on-balance sheet exposures (excluding derivatives, SFTs and exempted exposures)
80
LR3-LRSPL
5
30
Geographical distribution of credit exposures relevant for the calculation of the countercyclical buffer
81
CCyB1
5
31
Amount of institution-specific countercyclical capital buffer
82
CCyB2
5
32
Differences between statutory and prudential consolidated balance sheets and allocation to regulatory risk categories
83
LI1
5
33
Main sources of differences between regulatory exposure amounts and carrying amounts in financial statements
87
LI2
5
34
Prudent valuation adjustments (PVA)
88
PV1
6
35
Credit rating agencies used in standardised approach
96
6
36
13
Scope of the IRB and SA approaches
96
197
CR6-A
6
37
14
Scopes of application of the IRB and standardised approaches for the Group
97
197
6
38
15
Societe Generale’s internal rating scale and indicative corresponding scales of rating agencies
98
199
6
39
16
Main characteristics of models and methods – Wholesale clients
99
200
6
40
19
Main characteristics of models and methods used – Retail clients
101
203
6
41
Internal approach - backtesting of PD per exposure class (fixed PD scale) – AIRB
103
CR9
6
42
Internal approach - backtesting of PD per exposure class (fixed PD scale) – FIRB
107
CR9
6
43
Internal approach - backtesting of PD per exposure class (only for PD estimates according to point (F) of article 180(1) CRR) – AIRB
109
CR9.1
6
44
Internal approach - backtesting of PD per exposure class (only for PD estimates according to point (F) of article 180(1) CRR) – FIRB
112
CR9.1
6
45
21
Comparison of risk parameters: estimated and actual PD values – Retail clients
114
205
6
46
Exposure classes
116
6
47
22
Breakdown of exposures (credit and counterparty credit risks) on top five countries by exposure class (in %)
121
211
6
48
23
Change in risk-weighted assets (RWA) by approach (credit and counterparty credit risks)
121
211
6
49
Performing and non-performing exposures and related provisions
124
CR1
6
50
Changes in the stock of non-performing loans and advances
126
CR2
6
51
Credit quality of forborne exposures
126
CQ1
6
52
Credit quality of performing and non-performing exposures by past due days
128
CQ3
6
53
Credit quality of non-performing exposures by geography
130
CQ4
6
54
Credit quality of loans and advances to non-financial corporations by industry
134
CQ5
6
55
Collateral obtained by taking possession and execution processes
136
CQ7
6
56
Maturity of exposures
137
CR1-A
6
57
12
Credit risk mitigation techniques – Overview
137
195
CR3
6
58
Information on loans and advances subject to legislative and non-legislative moratoria
138
6
59
Breakdown of loans and advances subject to legislative and non-legislative moratoria by residual maturity of the moratoria
140
6
60
Information on newly originated loans and advances provided under newly applicable public guarantee schemes introduced in response to Covid-19 crisis
142
6
61
Credit risk exposure, EAD and RWA by exposure class and approach
144
6
62
Standardised approach – Credit risk exposure and credit risk mitigation (CRM) effects
145
CR4
6
63
Standardised approach – Credit risk exposures by regulatory exposure class and risk weights
147
CR5
6
64
Internal approach – Credit risk exposures by exposure class and PD range – AIRB
148
CR6
6
65
Internal approach – Credit risk exposures by exposure class and PD range – FIRB
155
CR6
6
66
IRB approach – Effect on RWA of credit derivatives used as CRM techniques
158
CR7
6
67
Internal approach – Disclosure of the extent of the use of CRM techniques – AIRB
159
CR7-A
6
68
Internal approach – Disclosure of the extent of the use of CRM techniques – FIRB
161
CR7-A
6
69
RWA flow statement of credit risk exposures under the IRB approach
162
CR8
6
70
Specialised lending exposures – internal approach
163
CR10.1-10.4
6
71
Equity exposures under the simple risk-weighted approach
164
CR10.5
7
72
25
Counterparty credit risk exposure, EAD and RWA by exposure class and approach
171
219
7
73
26
Analysis of counterparty credit risk exposure by approach
172
220
CCR1
7
74
27
Exposures to central counterparties
173
221
CCR8
7
75
Composition of collateral for counterparty credit risk exposures
174
CCR5
7
76
28
Transactions subject to own funds requirements for CVA risk
174
221
CCR2
7
77
Internal approach – Counterparty credit risk exposures by exposure class and PD scale
175
CCR4
7
78
Standardised approach – Counterparty credit risk exposures by regulatory exposure class and risk weights
177
CCR3
7
79
Credit derivatives exposures
179
CCR6
7
80
RWA flow statement of counterparty credit risk exposures under the IMM
179
CCR7
8
81
Securitisation exposures in the non-trading book
187
SEC1
8
82
Securitisation exposures in the trading book
189
SEC2
8
83
Exposures securitised by the institution – Exposures in default and specific credit risk adjustments
191
SEC5
8
84
Credit rating agencies used in securitisations by type of underlying assets
192
8
85
Securitisation exposures in the non-trading book and associated regulatory capital requirements – institution acting as originator or as sponsor
193
SEC3
8
86
Securitisation exposures in the non-trading book and associated regulatory capital requirements – institution acting as investor
195
SEC4
9
87
29
Regulatory ten-day 99% VaR and one-day 99% VaR
206
227
9
88
30
Regulatory ten-day 99% SVaR and one-day
99% SVaR207
229
9
89
31
IRC (99.9%) and CRM (99.9%)
209
230
9
90
32
Market risk RWA and capital requirements by risk factor
210
232
9
91
33
Market risk capital requirements and RWA by type of risk
211
232
9
92
Market risk under the standardised approach
213
MR1
9
93
Market risk under the internal model approach
213
MR2-A
9
94
Internal model approach values for trading portfolios
214
MR3
9
95
RWA flow statement of market risk exposures under the internal model approach
214
MR2-B
10
96
34
Operational risk own fund requirements and risk-weighted assets
223
240
OR1
11
97
35
Sensitivity of the Group’s value to a +10 bps interest rate variation
228
244
11
98
36
Sensitivity of the Group’s interest margin
228
244
99
Interest rate risk of non-trading book activities
229
IRRBB1
11
100
37
Sensitivity of the Group’s Common Equity Tier 1 ratio to a 10% change in the currency (in basis points)
230
245
12
101
Encumbered and unencumbered assets
235
AE1
12
102
Collateral received
236
AE2
12
103
Sources of encumbrance
237
AE2
12
104
38
Liquidity reserve
238
248
12
105
Liquidity Coverage Ratio
239
LIQ1
12
106
Net Stable Funding Ratio
241
LIQ2
12
107
39
Balance sheet schedule
243
249
(1)Universal Registration Document.
-
18.3 MAPPING TABLE OF EXPOSURE CLASSES
As part of the presentation of credit risk data, the table below shows the link between the synthetic presentations of certain tables and the exposure classes detailed in the tables requested by the EBA in the context of the revision of Pillar 3.
Approach
COREP exposure class
Pillar 3 exposure class
AIRB
Central governments and central banks
Sovereigns
AIRB
Institutions
Institutions
AIRB
Corporate - SME
Corporates
AIRB
Corporate - Specialised lending
Corporates
AIRB
Corporate - Other
Corporates
AIRB
Retail - Secured by real estate SME
Retail
AIRB
Retail - Secured by real estate non-SME
Retail
AIRB
Retail - Qualifying revolving
Retail
AIRB
Retail - Other SME
Retail
AIRB
Retail - Other non-SME
Retail
AIRB
Other non credit-obligation assets
Others
AIRB
Default funds contributions
Others
FIRB
Central governments and central banks
Sovereigns
FIRB
Institutions
Institutions
FIRB
Corporate - SME
Corporates
FIRB
Corporate - Specialised lending
Corporates
FIRB
Corporate - Other
Corporates
IRB
Equity Exposures
Others
IRB
Securitisation
Others
Standardised
Central governments or central banks
Sovereigns
Standardised
Regional governments or local authorities
Institutions
Standardised
Public sector entities
Institutions
Standardised
Multilateral development banks
Sovereigns
Standardised
International organisations
Sovereigns
Standardised
Institutions
Institutions
Standardised
Corporates
Corporates
Standardised
Retail
Retail
Standardised
Secured by mortgages on immovable property
Others
Standardised
Exposures in default
Others
Standardised
Items associated with particularly high risk
Others
Standardised
Covered bonds
Others
Standardised
Claims on institutions and corporate with a short-term credit assessment
Others
Standardised
Claims in the form of CIU
Others
Standardised
Equity Exposures
Others
Standardised
Other items
Others
Standardised
Default funds contributions
Others
Standardised
Securitisation
Others
-
18.4 ABBREVIATIONS TABLE
Abbreviation
Meaning
ABS
Asset-Backed Securities
ACPR
Autorité de contrôle prudentiel et de résolution (French supervisory authority)
ALM
Asset and Liability Management
CCF
Credit Conversion Factor
CDS
Credit Default Swap
CDO
Collaterallised Debt Obligation
CLO
Collateralised Loan Obligation
CMBS
Commercial Mortgage-Backed Securities
CRD
Capital Requirement Directive
CRM (credit risk)
Credit Risk Mitigation
CRM (market risk)
Comprehensive Risk Measure
CRR
Capital Requirement Regulation
CVaR
Credit Value at Risk
EAD
Exposure At Default
ECB
European Central Bank
EL
Expected Loss
IMM
Internal Model Method
IRBA
Internal Ratings-Based approach – Advanced
IRBF
Internal Ratings-Based approach – Foundation
IRC
Incremental Risk Charge
G-SIB
Global Systemically Important Bank
LCR
Liquidity Coverage Ratio
LGD
Loss Given Default
MREL
Minimum Requirement for own funds and Eligible Liabilities
NSFR
Net Stable Funding Ratio
PD
Probability of Default
RMBS
Residential Mortgage-Backed Securities
RW
Risk Weight
RWA
Risk-Weighted Assets
SREP
Supervisory Review and Evaluation Process
SVaR
Stressed Value at Risk
TLAC
Total Loss Absorbing Capacity
VaR
Value at Risk